Information
Introduction
Many proteins do not share significant global sequence
similarity to any other known proteins.
These proteins may contain domains or motifs that confer distinct
structures and functions conserved through evolution. The conserved modules are usually enriched by
characteristic sequence elements, or sequence motifs, that are shared only with
proteins of similar origin or functionality. Many sequence analysis studies
rely on discrete sequence motifs to classify newly discovered proteins into
proper families. The methods used to
generate the discrete sequence motifs, therefore, play a vital role in
determining the specificity and sensitivity of the classification performed by
these tools. In biological
sequences, the occurrence of several conserved motifs is often more informative
than the presence of a single motif.
This server (SCANMOT) describes a method, which combines
multiple-pattern with a search for statistically significant sequence
similarity. The specificity of the search engine is increased by utilising the
inter-motif spacing and pairwise global alignment of
the query and hits.
Algorithm
SCANMOT works in three different
steps to find similar proteins having the specified motifs: (1) the first step
is to seek for the motifs within the query sequence to record the inter-motif
spacing for all possible combination of the specified motifs. (2) Next, the motifs are scanned into a
sequence database and sequences having specified number of motifs are
reported. (3) The third step is to align the query sequence and each of the .hit. by an algorithm, which initially fixes the motif regions between the query and hit and aligns the rest using dynamic programming techniques in segments
(Saikat
Chakrabarti, Bhardwaj, N., Prem Anand, A. and R. Sowdhamini, BMC Bioinformatics. 2004 Oct 28;5(1):167. ). Significance for scores is attributed by benchmarking using known
examples after arriving at thresholds.
The server allows the user to select a relaxation filter for each
residue within the motif for a wider range of ‘hits’ or similar sequences with
allowed substitutions. Figure1
shows a snapshot of result of a test run along with possible homologues in the output.
Motif Spacer
For N number of motifs for a given query protein, N*(N-1)/2 combination of inter-motif spacing is possible. For example, if a sequence has 4 motifs (A, B, C and D), there are 6 different motif-pair spacing can be possible (like, AB, AC, AD, BC, BD and CD). Similarly, within the 'hit' if all the 4 motifs (a, b, c and d) are present there will be 6 different motif spacers (like, ab, ac, ad, bc, bd and cd). For each equivalent spacing between query and hit (like AB and ab), a "relaxation filter" is applied to make the motif based search more sensitive. Our benchmarking studies indicated that 30% relaxation of equivalent motif spacing provide optimal results with high specificity. So, if the spacing between query and hit passes the relaxation filter, we select it as a matched-motif pair (AB and ab). Now, Grade A is assigned to a 'hit' when the number of matched-motif pair equals or exceeds 80% of the all possible combination of motif spacers from the query (AB, AC, AD, BC, BD and CD). Similarly Grades B, C and D are assigned when all the inter-motif spacing is matched for =>60% - <80%, =>40 - <60, =< 40% of the all possible motif spacer combination, respectively (please see Figure 2b on benchmarking for details on these ranges).
Percentile Alignment Score
The alignment score (Align Score)
is represented as a measure for similarity between the query and the hit. A percentile gradation scale has been applied
for all the query-hit alignments with respect to the top scoring alignment
pair. Together with the alignment score the extent of similarity between the
query and the hits are also represented by an amino acid similarity score (Sim. Score) and percentage identity (Percen.
ID).
1. The grade can be poor and still if the similarity score is positive
(> 20), either the protein is annotated to be a K+ channel (example
18203381 in the example run) or a hypothetical protein that has the potential to be channel
protein (example 13472878 in the example run). This could either be due to lack of
conservation of all motifs provided by the user or due to unusual
inter-motif spacing.
2. The grade can be A and still if the similarity score drops down, it
could be a false positive (example 15644489 in the example run). It only reflects that such
motifs are present in unrelated proteins with similar inter-motif spacing.
3. If similarity score is high and Grades are good, the hit is highly likely
to be a true positive (example 18203376 in the example run).
4. If similarity score is poor and Grades are also poor, the hit is very
likely to be a false positive (example 15789702 in the example run).
Hits with known three-dimensional
structure are identified and also marked by the Protein Data Bank (PDB Bernstein et al., 1977; Berman et al., 2000) and SCOP (Murzin et al.,
1995) code together with their accession number for better visualisation and
understanding of scanning results. Frequency of occurrence of each motif is
represented by a bar diagram labelling each motif with a different colour code
(Figure 1).
Scanning similar sequences in
databases
SCANMOT provides option for
searching similar sequences in well-curated sequence
databases such as Protein Data Bank (PDB) SCOP, SWISSPROT (Apweiler et al., 1997) and Non Redundant database (NR). There is also an
option provided for searching similar motifs and sequences in individual genome
databases of model organisms like bacteria, yeast, worm, fly, mouse, human and
plant. Further, user-defined (custom)
sequence database can be uploaded in FASTA (Pearson and Lipman,
1988) format and similar motif and sequences in that dataset can be searched.
Large scale benchmarking studies
show high specificity and moderate sensitivity of the SCANMOT search engine (Chakrabarti and Sowdhamini,
2004).
Motif pattern
The input patterns can be in PROSITE format or in the format of structural templates as recorded in SMoS and SSToSS pages.
Example for SMOS and SSTOSS pattern:
[
[EN][Q][AVI][E][X][H]
Where, [X] can be any
residue. Multiple occurrence of one residue in consecutive positions should be
represented as [X][X][X] or [LY][LY].
The motifs must be
present in the query sequence. Two consecutive positions should not be
connected by "-" or ".".
Relaxation filter for motifs
An option is provided
to invoke a similar residue substitution for each residue within the motifs. This
filter enables the user to obtain a relaxed coverage of the motif based similar
sequence search.
Correlation between Grades,
alignment score and the percentage of true hits
Alignment scores and the grades purely based on
inter-motif spacing are positively correlated (Figure 2a). A gradual decrease in the average alignment
score has been observed with respect to the decrease in the grades of
percentage match in the inter-motif spacing.
Figure 2b also produces similar correlation between the percentage of
true positives and their respective grades.
Therefore, this analysis indicates that the nature of grade as well as
the alignment score can influence quality of the sequence search procedure in a
synergistic manner.
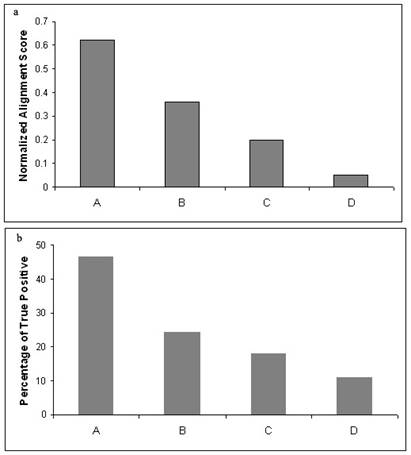
Higher alignment scores are observed for better grades
similarly (b) higher numbers of true positives are also shown to be present
along with high grade. Therefore the coexistence of high grade and alignment
score can indicate the presence of true positives.
Hits under Grade A vary upto 20% from query in inter-motif spacing, Grade
B vary between 20-40% from query, Grade C vary between 40-60% and Grade D
hits vary more than 60% from query in inter-motif spacing.
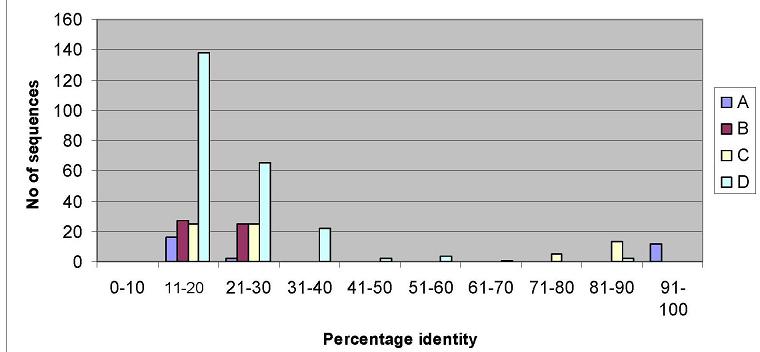
Correlation between Grades and
percentage identity
Filtering PSI-BLAST outputs
SCANMOT also provides options to filter PSI-BLAST (Altschul et al.,
1997) output of query sequence and identify significant homologous sequences
defined in terms of presence of motifs for a query protein family. This option
extracts true positives from PSI-BLAST outputs, defined in terms of presence of
motifs and provides a valuable validation and analysis tool for PSI-BLAST
derived sequence searches. Figure 3 shows the
proteins identified by SCANMOT is closer to the number of actual true positives
and the number of total false positive is also lesser compared to that of
PSI-BLAST.
Download local version of SCANMOT
References:
Apweiler, R., Gateau, A., Contrino, S., Martin ,M.J., Junke,r V., O'Donovan, C., Lang, F., Mitaritonna,
N., Kappus, and S., Bairoch,
A. (1997) Protein sequence annotation in the genome era: the annotation concept
of SWISS-PROT + TREMBL. ISMB-97; Proceedings 5th
International Conference on Intelligent Systems for Molecular Biology, 33-43,
AAAI Press,
Altschul,S.F., Madden,T.L.,
Schäffer,A.A., Zhang,J., Zhang,Z., Miller,W. and Lipman,D.J. (1997). Gapped BLAST and PSI-BLAST: a
new generation of protein database search programs. Nucleic Acids Res., 25,
3389–3402.
Berman, H. M., Westbrook, J., Feng, Z., Gilliland, G., Bhat,
T,N., Weissig, H., Shindyalov,
I.N. and Bourne, P. E. (2000) The
Protein Data Bank. Nucleic Acids Res., 28, 235-242.
Bernstein, F.C., Koetzle,
T.F., Williams, G.J., Meyer, E.F Jr., Brice, M.D.,
Rodgers, J.R., Kennard, O., Shimanouchi, T. and Tasumi, M. (1977). The Protein Data Bank.
A computer-based archival file for macromolecular structures.
Eur J Biochem., 80,
319-324.
Chakrabarti S and Sowdhamni R (2004). Regions of minimal structural variation
among members of protein domain superfamilies: Application to remote homology detection and
modelling using distant relationships. FEBS letters (in press).
Muller, A., MacCallum, R. M.
and Sternberg, M. J. (1999) Benchmarking PSI-BLAST in genome annotation. J. Mol. Biol., 293, 1257-1271.
Murzin, A.G.,
Brenner, S.E., Hubbard, T. and Chothia, C. (1995). SCOP: a structural
classification of proteins database for the investigation of sequences and
structures. J. Mol. Biol., 247, 536-540.
Pearson, W.R. and Lipman, D.J. (1988). Improved tools for
biological sequence comparison. Proc. Natl
Acad. Sci. USA., 85, 2444–2448.