The PASS2 database contains alignments of protein structures at the superfamily level in direct correspondence with SCOPe 2.08 release (Structural Classification Of Proteins, Murzin et al., 1995). PASS2 uses the ASTRAL dataset at 40% sequence identity, with superfamilies categorised as single-member and multi-member superfamilies (SMS; MMS).
Browsing the database
The database can be browsed efficiently using several search facilities. The database may be queried using the superfamily code, superfamily name, and keywords.
-
To search by superfamily code, enter a valid superfamily code (numeric code as mentioned in SCOPe). For example: To search the "globin-like" superfamily, enter "46458".
-
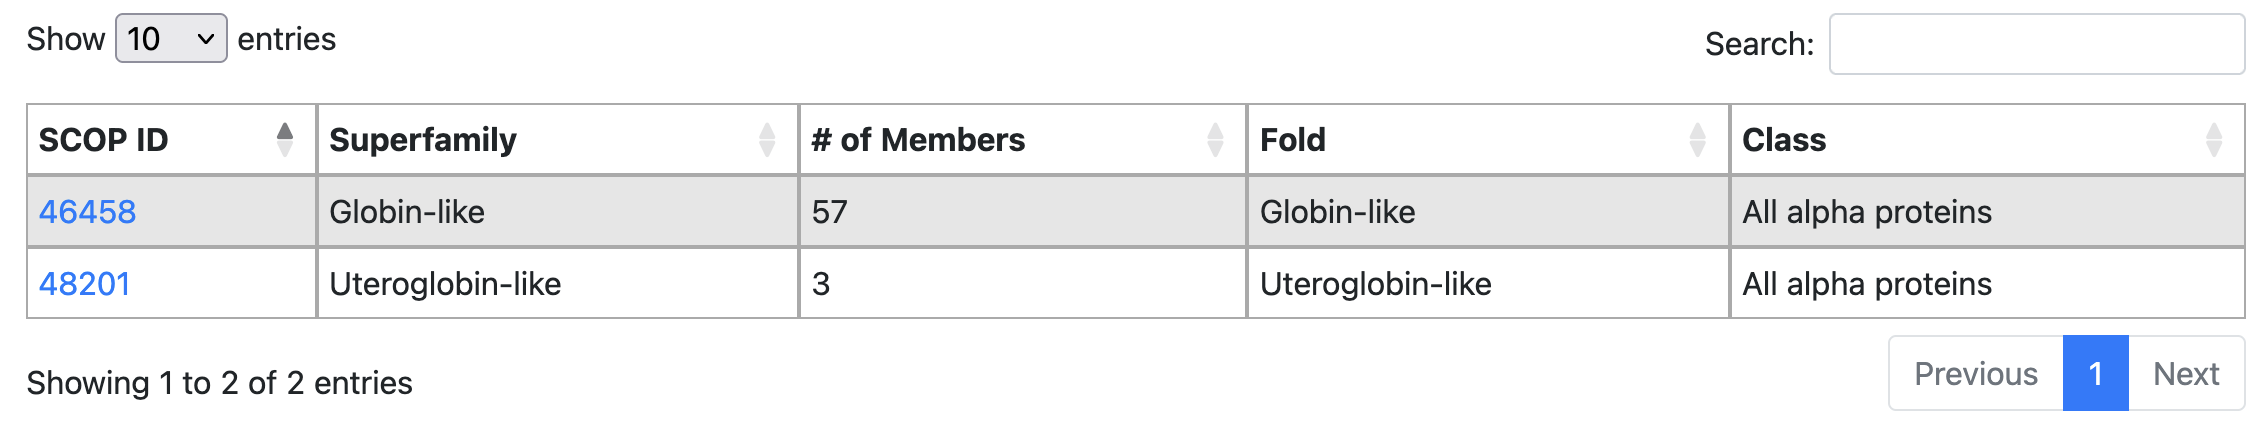
To search by key terms or superfamily name, enter a full length or partial term. For example: Entering the term "globin-like" will show the following results on the webpage:
Database features
-
Matrices: The pairwise sequence identity between the members of the superfamily is provided as a percentage identity matrix (IDENT.mat) and pairwise sequence distances between two structures, calculated as (-100*ln(ID/100)) are provided in a DIST.mat file. Both are calculated using the JOY4 program.
-
CUSP results: Distantly related proteins adopt and retain similar structural scaffolds despite length variations that could be as much as two-fold in some protein superfamilies. CUSP examines protein domain structural alignments to distinguish regions of conserved structure common to related proteins from structurally unconserved regions that vary in length and type of structure. Consecutive positions with high scores are merged to identify structurally conserved blocks and distinguish them from indels. An average score is associated with each such block and used to annotate the alignment to distinguish indel regions (unconserved structural blocks; USB) from 'core' regions (SSB) based on block scores as 'high, medium or poor' to indicate degree of conservation. Conserved structural blocks (H, E and C) are classified as: (a) High (block score 4.5-5.0), (b) Medium (block score 3-4.5), and (c) Poor (block score less than 3).
-
ALISTAT results: Alistat reads a multiple sequence alignment from the file in any supported format, and shows a number of simple statistics about it. These statistics include the name of the format, the number of sequences, the total number of residues, the average and range of the sequence lengths, the alignment length (e.g. including gap characters). A percent pairwise alignment identity is defined as (idents / MIN(len1, len2)) where idents is the number of exact identities and len1, len2 are the unaligned lengths of the two sequences. The "average percent identity", "most related pair", and "most unrelated pair" of the alignment are the average, maximum, and minimum of all (N)(N-1)/2 pairs, respectively. The "most distant seq" is calculated by finding the maximum pairwise identity (best relative) for all N sequences, then finding the minimum of these N numbers (hence, the most outlying sequence).
-
SMotif results: A set of structural motifs from protein structures is identified from the alignment using the in-house tool SMotif (2), by recognising the conservation of amino acid preference and solvent inaccessibility and the conservation of other features like secondary structural content, hydrogen bonding and residue packing. A structural feature is considered as conserved at an alignment position if it is present in all or all but-one members within the alignment. The motifs are ranked by the extent of conservation of the structural feature. These structural motifs are listed in the PROSITE format, are mapped on the alignment and are available as a downloadable file for each superfamily.
-
MeanRMS: This file contains the average Cα RMSD of each structure with respect to others in the superfamily, and is obtained from the final superimposed structure of all members of the superfamily which could be aligned using COMPARER.
-
Percentage Conserved Secondary Structure Elements: These files contain details of the secondary structure elements conserved in all members of the superfamily.
-
Topological diagrams: These files contain topological diagrams of the domain structures and are created using PDBsum1.
-
Potential interactors: Potential interactors for superfamily members are identified via STRINGDb, and the link to the page is provided.
-
Residue conservation: Residues that are absolutely conserved (100%) and highly conserved (> 90%) in the alignment are mapped onto the alignment for visualisation.
-
Conserved interactions: Intra-domain interactions that are spatially conserved in superfamily members are both listed and visualised, with figure files and PyMOL session files available for download. The interactions are identified using an in-house software called HORI (Higher Order Residue Interaction; unpublished results; Sarthak Joshi and Ramanathan Sowdhamini)
-
GO terms: Gene Ontology (GO) terms for superfamily members have also been made available.
-
Outliers: Outliers are domains which are not included in the alignment. These protein domain entries were originally considered as part of the superfamily, but could not be included in the alignment due to various reasons as follows:
-
High root mean square deviation (RMSD)
-
Impossible to obtain initial equivalences when it is included in the core alignment
-
Consistent difficulties for multiple structure alignment programs to deal with the entries.
-
References:
K Mizuguchi, C M Deane, T L Blundell, M S Johnson, J P Overington. JOY: protein sequence-structure representation and analysis.Bioinformatics 1998, 14, 617–623.
Sankaran Sandhya, Barah Pankaj, Madabosse Kande Govind, Bernard Offmann, Narayanaswamy Srinivasan, and Ramanathan Sowdhamini. CUSP: an algorithm to distinguish structurally conserved and unconserved regions in protein domain alignments and its application in the study of large length variations BMC Struct Biol. 2008; 8: 28.
Eddy S: SQUID - C function library for sequence analysis [http://selab.janelia.org/software.html] 2005.
Ganesan Pugalenthi, P. N. Suganthan, R. Sowdhamini and Saikat Chakrabarti. SMotif: a server for structural motifs in proteins. Bioinformatics 2007 23(5):637-638.
Laskowski R. A. PDBsum1: A standalone program for generating PDBsum analyses. Proteinscience : a publication of the Protein Society 2022, 31(12), e4473.
Damian Szklarczyk, Rebecca Kirsch, Mikaela Koutrouli, Katerina Nastou, Farrokh Mehryary,
Radja Hachilif, Annika L Gable, Tao Fang, Nadezhda T Doncheva, Sampo Pyysalo, Peer Bork, Lars J Jensen, Christian von Mering. The STRING database in 2023: protein–protein association networks and functional enrichment analyses for any sequenced genome of interest. Nucleic acids research 2023, 51.D1: D638-D646.
Ashburner et al. Geneontology:tool forthe unificationof biology. Nat Genet. 2000 May;25(1):25-9.
The Gene Ontology Consortium. The Gene Ontology knowledgebase in 2023. Genetics. 2023 May 4;224(1):iyad031.