Overview
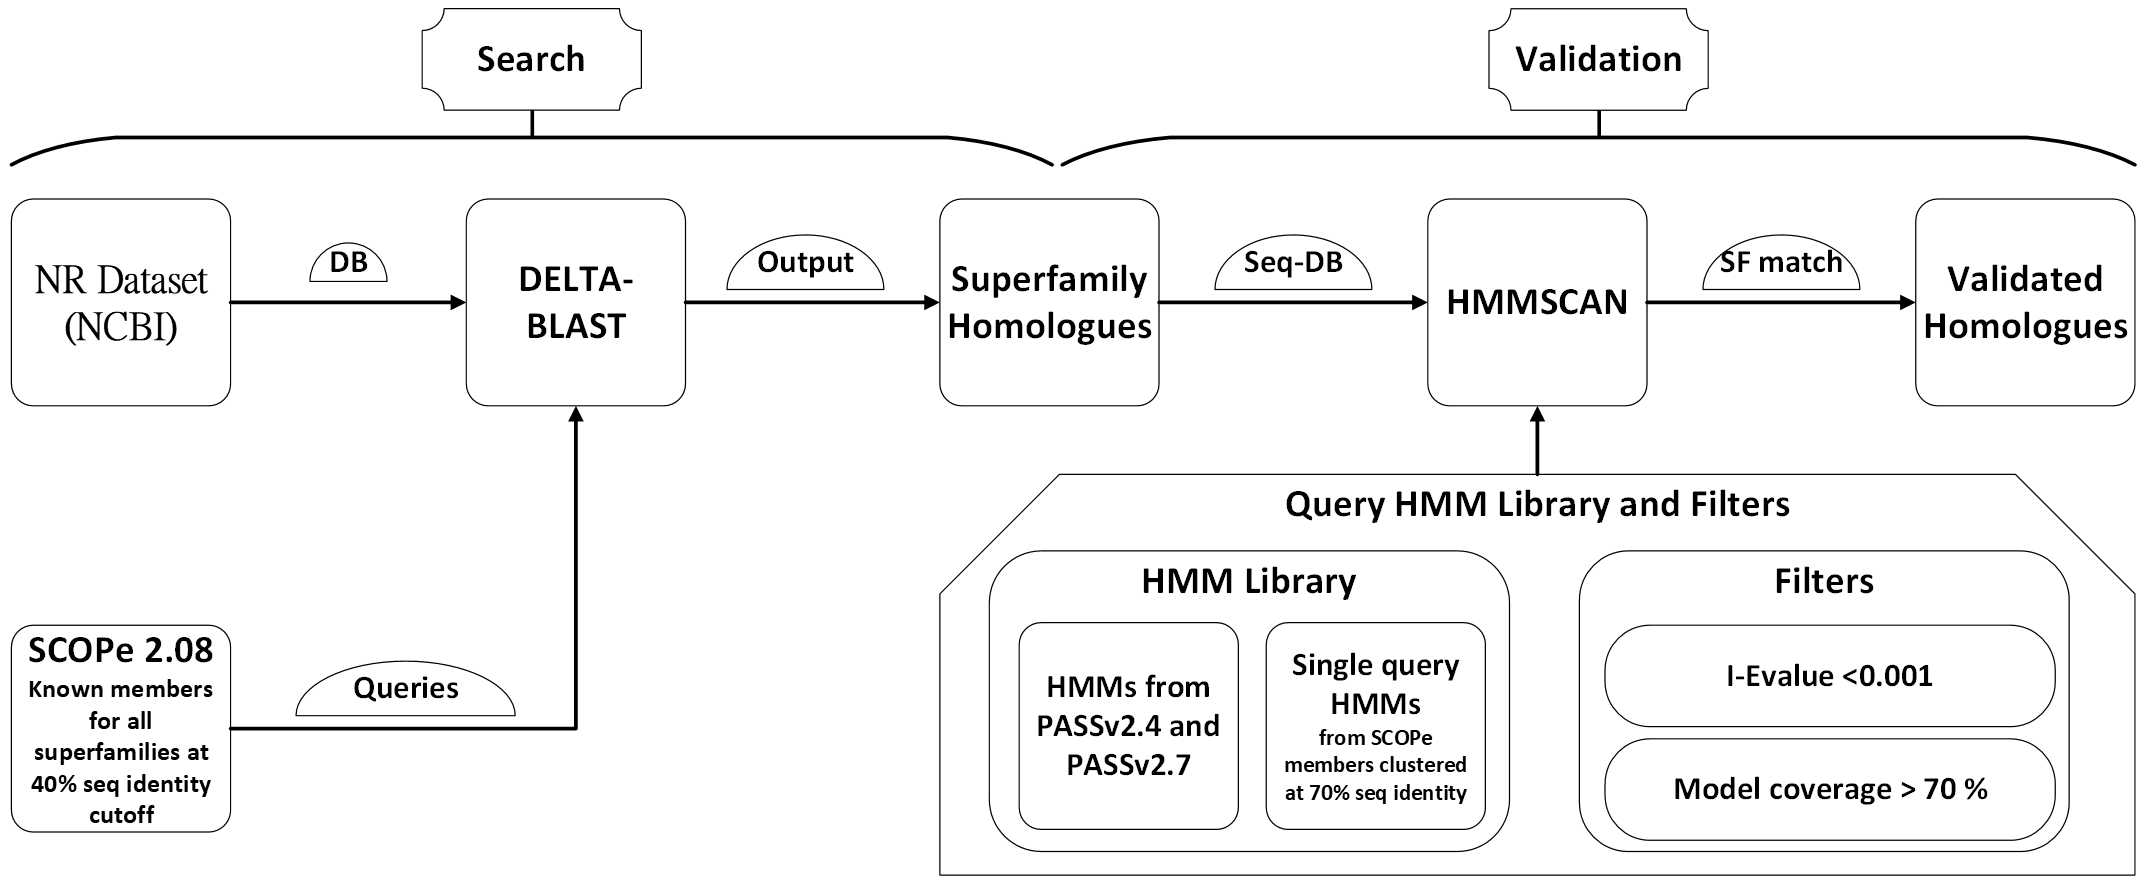
Below is the workflow diagram that outlines the process for searching and validating homologues in the GenDiS 3.0 database:
The GenDiS 3.0 database offers an intuitive interface for browsing data by:
- Superfamily: View a list of all superfamilies, including SCOP codes, descriptions, and associated data. The interface allows searching and filtering by description or SCOP ID.
- Fold: Browse folds and their associated superfamilies. Each fold entry includes a dropdown to explore superfamilies within the selected fold.
- Class: Explore broader structural classes containing folds and their respective superfamilies.
Screenshots:
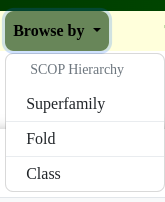
Fig: Dropdown menu to browse by superfamily, fold, or class.
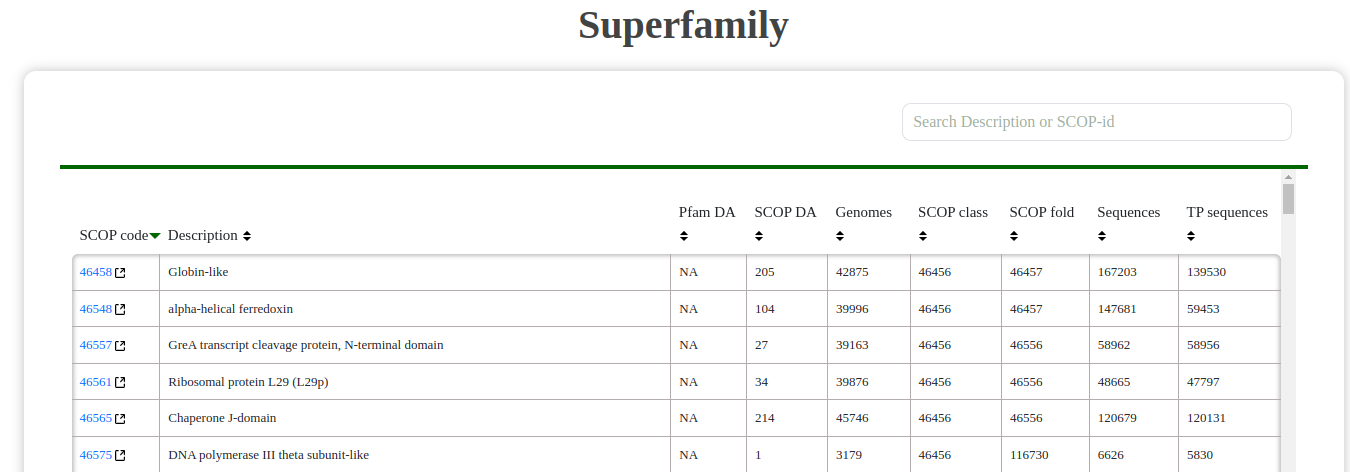
Fig: Superfamily table showing SCOP codes and descriptions.
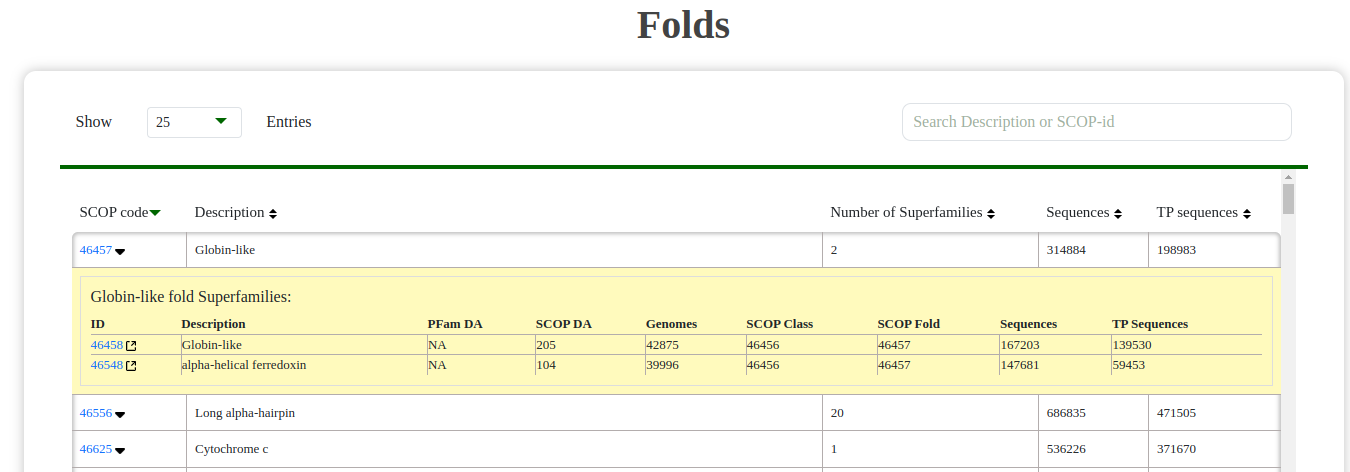
Fig: Fold table with expandable dropdowns to view associated superfamilies.
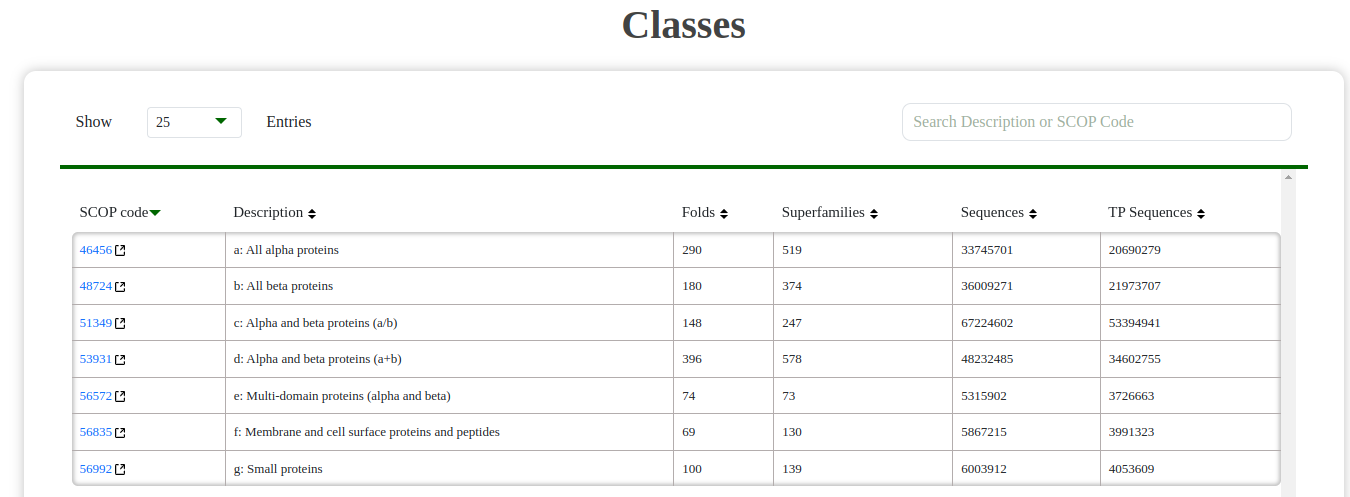
Fig: Class table showing folds and their hierarchical organization.
Each superfamily in GenDiS 3.0 has a detailed page that provides comprehensive data and tools, including:
- Summary: Basic information about the superfamily, including SCOP code, description, and sequence statistics.
- Taxonomic Distribution: A colorful sunburst chart visualizing the taxonomy of sequences within the superfamily.
- Domain Architectures: Interactive visualizations of SCOP and Pfam domain architectures. Clicking on a domain redirects to the respective database for more details.
- SF homologues: A table containing all the obtained homologues of the superfamily. User can search using NCBI accession ID and NCBI taxonomic ID. Links to the NCBI pages for the homologues can also be found here.
Screenshots:
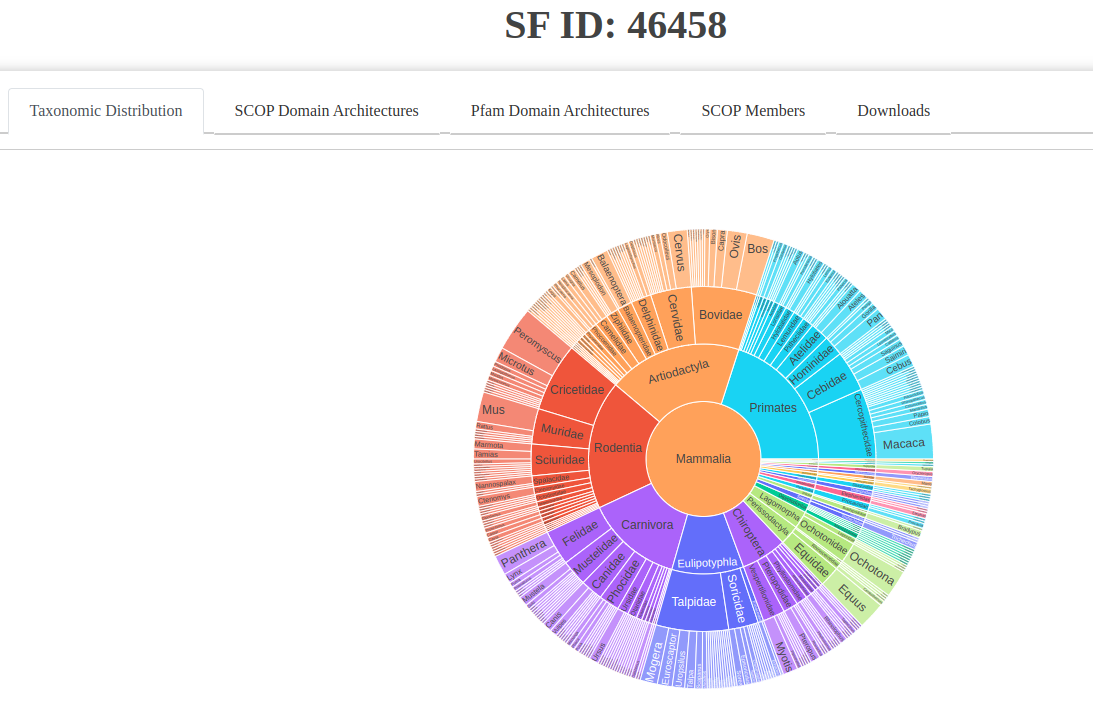
Fig: Taxonomic distribution visualized as a sunburst chart.
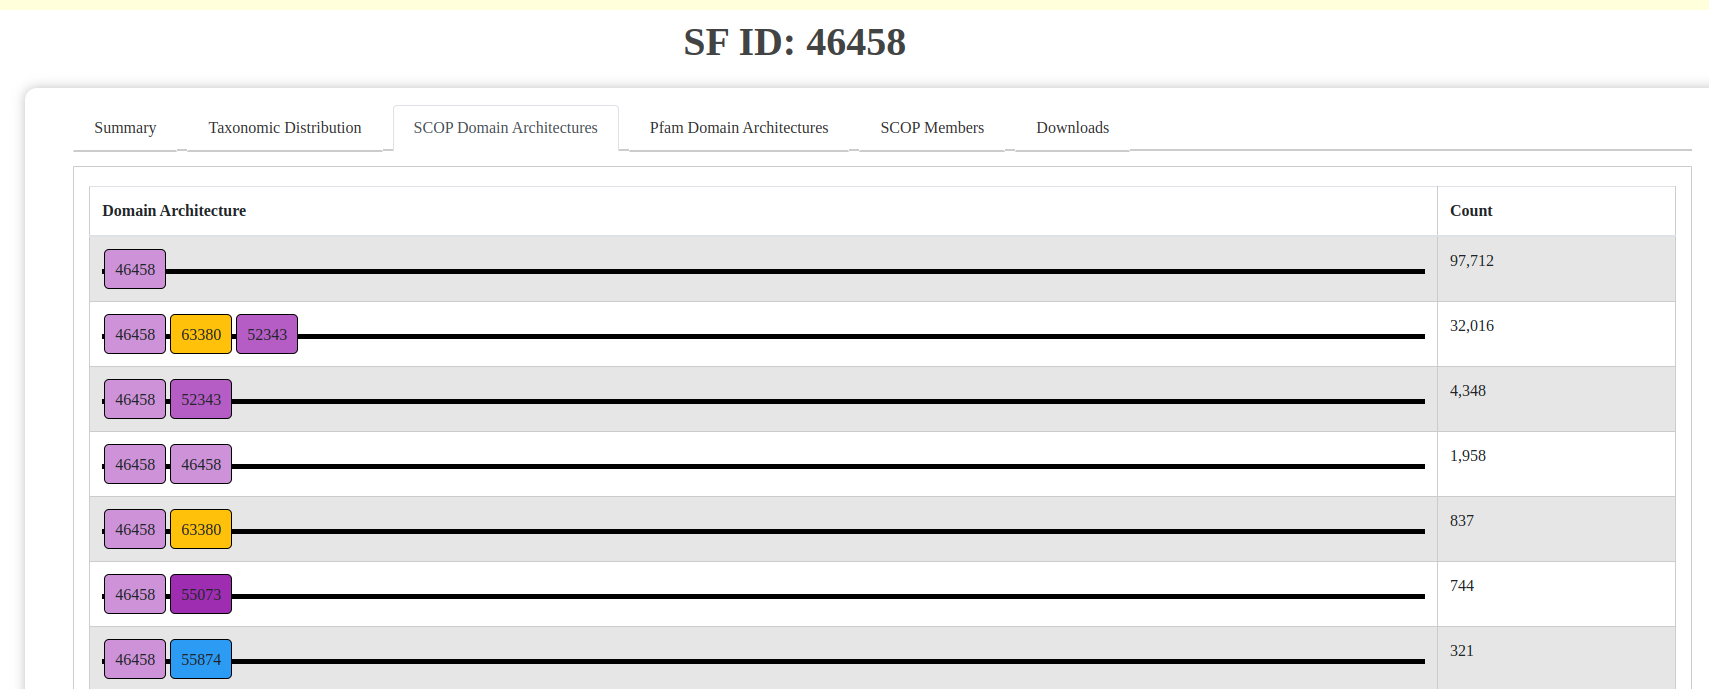
Fig: SCOP domain architecture visualization.
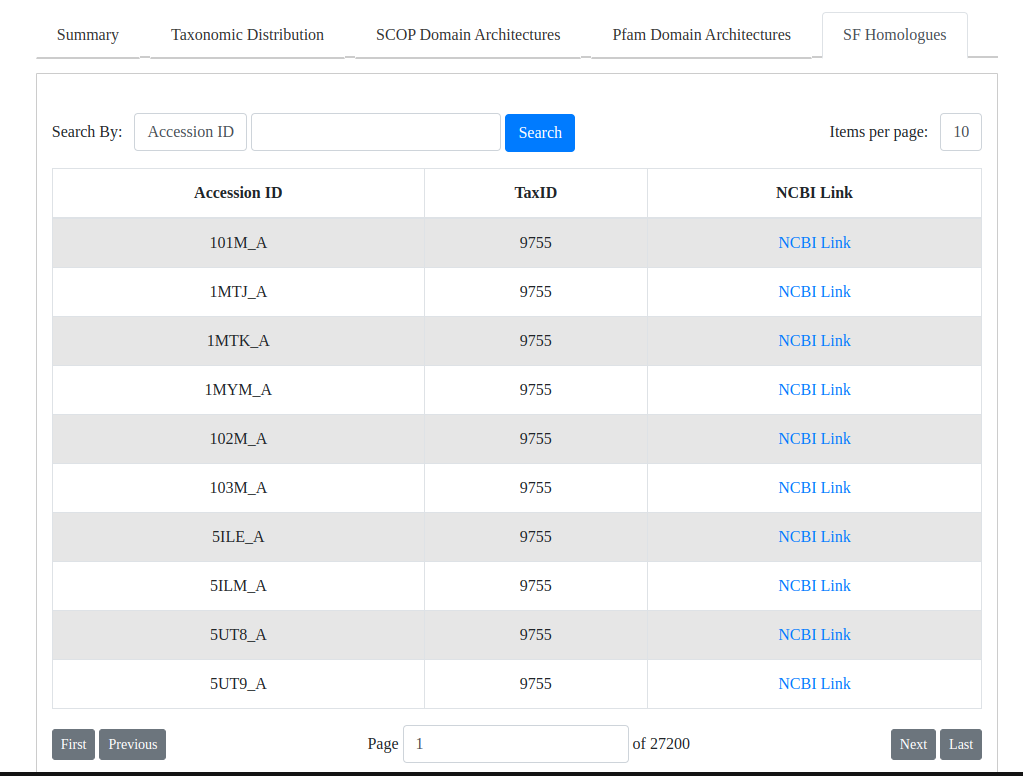
Fig: Table of homologues for the selected superfamily.
Methodology
Time Required for DELTA-BLAST and HMMSCAN:
| Class | Total #SFs | Total DELTA-BLAST Hits | Total Validated Hits | Time Required for DELTA-BLAST | Time Required for HMMSCAN |
|---|---|---|---|---|---|
| Mostly alpha | 519 | 33M | 20M | ~4000H | ~624H |
| Mostly beta | 374 | 36M | 21M | ~3500H | ~984H |
| Alpha and beta | 578 | 48M | 34M | ~1900H | ~840H |
| Alpha or beta | 247 | 67M | 53M | ~3600H | ~1512H |
| Small proteins | 73 | 5M | 3M | ~500H | ~260H |
| Multidomain proteins | 130 | 5M | 3M | ~620H | ~380H |
| Membrane proteins | 139 | 6M | 4M | ~500H | ~400H |
| Total | 2060 | 202M | 142M | ~6 months | ~4 months |
The overall time required for running the search and validation processes spans around 6 months for DELTA-BLAST and 4 months for HMMSCAN, due to the computational complexity involved in analyzing millions of sequences.
Tools and Features
This tool allows users to predict the domain architecture of their sequences using SCOPe or Pfam. It can annotate new sequences or verify the domain structure of known proteins, supporting functional annotation efforts.
Screenshot of Predict Domain Architecture Tool:
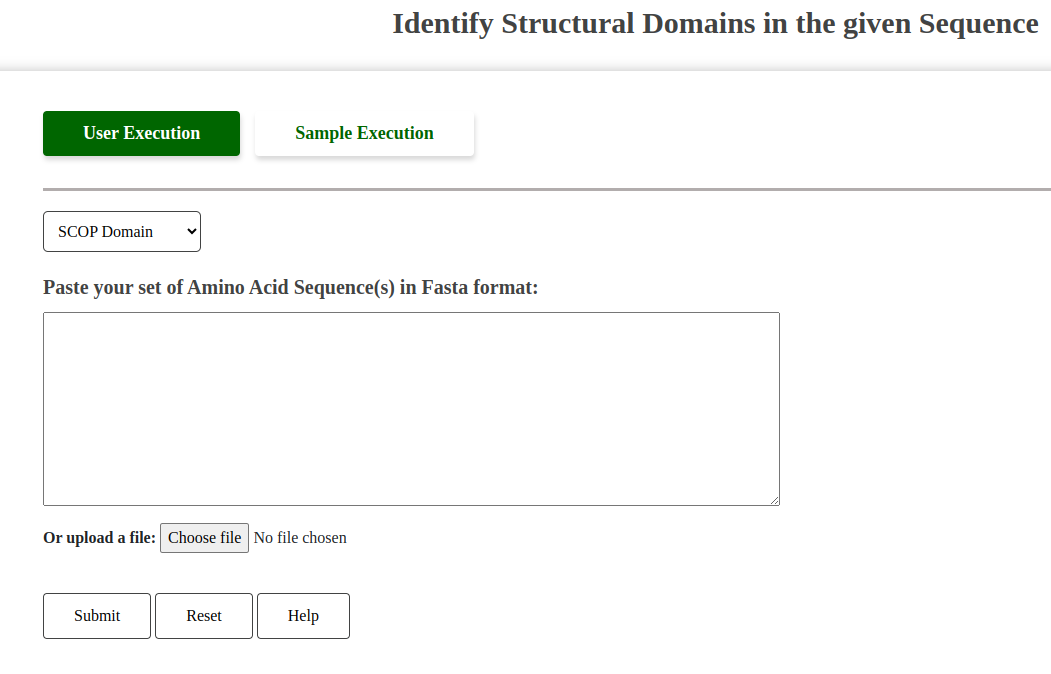
Fig: Predict Domain Architecture Tool Interface.
Tool Options:
Users must select between two options for domain architecture prediction:
- SCOP: Uses SCOP hidden Markov models (HMMs) for domain prediction.
- Pfam: Utilizes Pfam HMMs for domain prediction.
Help Button Functionality:
The "Help" button provides guidance on valid FASTA formats required for input, similar to other tools.
Compare the superfamily hits between two different genomes to explore evolutionary conservation and divergence. This tool is particularly useful for researchers studying comparative genomics.
Screenshot of Align Two Genomes Tool:
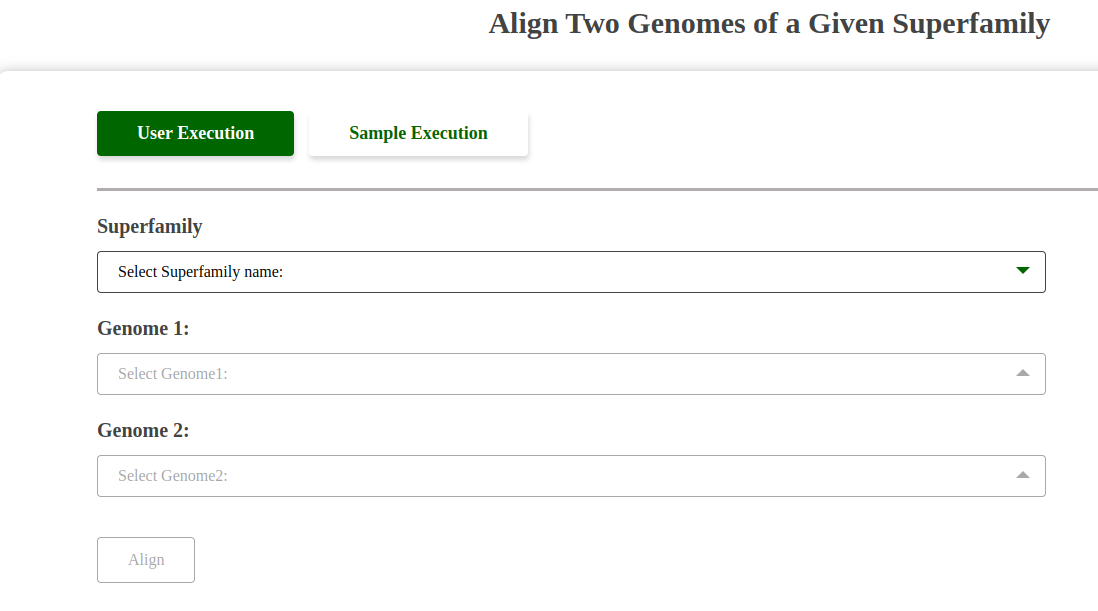
Fig: Align Two Genomes Tool Interface.
Dropdown Functionality:
This tool features three dropdowns:
- Superfamily Dropdown: Allows the user to select a superfamily.
- Genome 1 Dropdown: Populates with the genomes available in the selected superfamily for comparison.
- Genome 2 Dropdown: Populates similarly to Genome 1, enabling selection of the second genome for alignment.
The interaction ensures precise and meaningful alignment between the chosen genomes within the selected superfamily.
Users can align their own sequence against the sequences from a genome of a given superfamily to identify homologous regions and potential functional elements.
Screenshot of Align Tool:
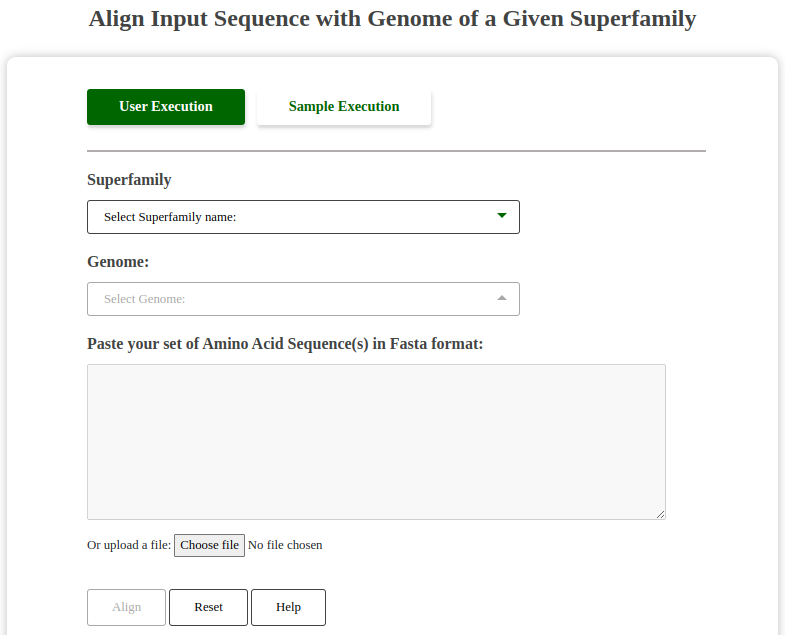
Fig: Align User Sequence with Genome Tool Interface.
Dropdown Functionality:
This tool features two dropdowns:
- Superfamily Dropdown: Allows the user to select a superfamily.
- Genome Dropdown: Gets populated dynamically based on the selected superfamily, showing the genomes available within the chosen superfamily.
The dropdown interaction ensures that users only work with relevant genomes for their selected superfamily, streamlining the alignment process.
Help Button Functionality:
The "Help" button provides a pop-up description of valid FASTA formats required for input, similar to the BLAST search tool.
This tool allows users to perform a BLAST search against the entire set of homologous sequences in the GenDiS database. It can help identify homologues by comparing sequences to those within superfamilies.
Screenshot of BLAST Search Tool:
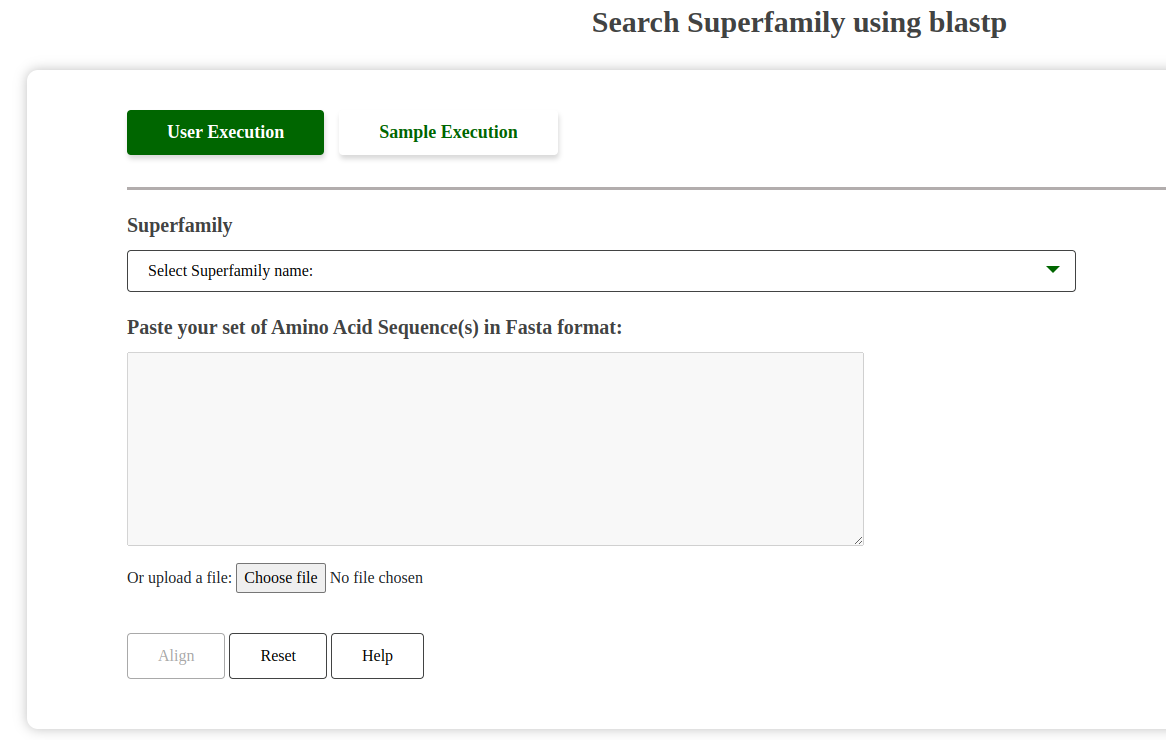
Fig: BLAST Search Superfamily Tool Interface.
Dropdown Selection and Performance Warning:
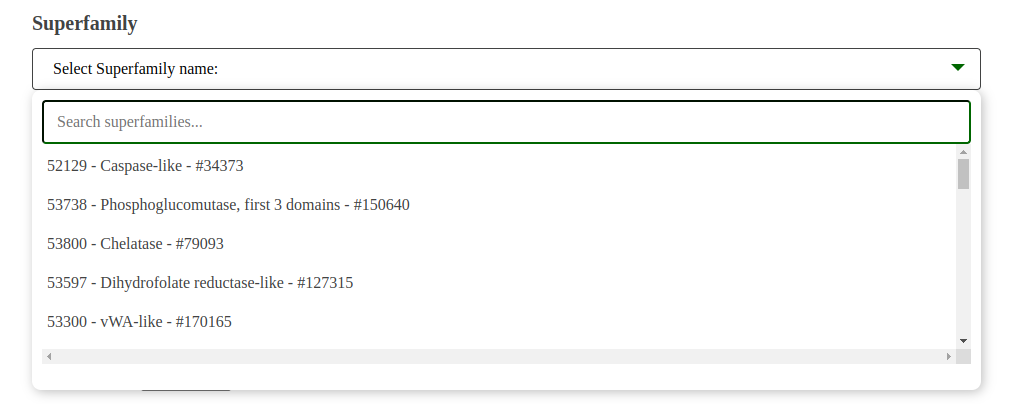
Fig: Superfamily Dropdown for BLAST Search.
The dropdown menu allows users to select a superfamily, displaying the number of sequences to be searched. This number directly impacts the search time. For example, 30,000 sequences may take approximately 20 minutes to complete the search.
Help Button Functionality:
The "Help" button provides a pop-up description of valid FASTA formats required for input.
Users can download list of homologues of SCOPe superfamilies identified by GenDiS 3.0 and the SCOP domain architectures of the homologues.
Screenshots of Download Options:
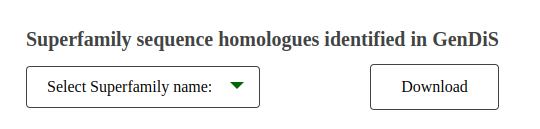
Fig: Superfamily sequence homologues identified in GenDiS.
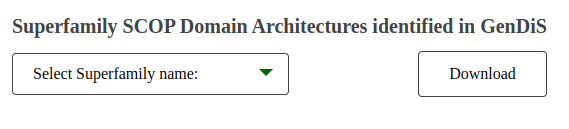
Fig: Superfamily SCOP Domain Architectures identified in GenDiS.
Description of Output Files:
The downloaded files open as text in a new tab and are formatted as TSV files. Below are the descriptions of the two types of output files:
-
Superfamily Sequence Homologues:
- Columns: #SCOPe_sf_id, ncbi_accession, ncbi_taxid
- Description: This file lists the homologous sequences identified in GenDiS for a selected superfamily. Each row corresponds to a sequence and provides its SCOPe superfamily ID, NCBI accession number, and taxonomy ID.
- Example:
#SCOPe_sf_id	ncbi_accession	ncbi_taxid
		52129	1CVR_A	837
		52129	1F1J_A	9606
		52129	1F9E_A	9606
-
SCOP Domain Architectures:
- Columns: ncbi_accession_id, scop_da, domain_boundaries, length
- Description: This file provides the SCOP domain architectures for the sequences, including domain boundaries and total sequence length. The sequence positions in the domain boundries correspond to the residue positions in protein sequences obtained from NCBI (identified by NCBI accession ID).
- Example:
#ncbi_accession_id	scop_da	domain_boundaries	length
		1CVR_A	52129-81296 d1cvra1	111-350-351-432	435
		1F9E_A	52129_pass27	1-152	153