Database Of Olfactory Receptors:
DOR is an integrated database to provide sequence and structural information on Olfactory receptors (OR) of selected organisms such as Saccharomyces cerevisiae, Drosophila melanogaster, Caenorhabditis elegans, Mus musculus and Homo sapiens.
I. Information On Sequences of ORs:
With a prior knowledge on cross-genome phylogenetic analysis we have tried to understand the conserved evolutionary trends, clustering and orthologs at inter and intra genomic level for olfactory receptors (OR) in targeted organisms.
DOR (Database Of Olfactory Receptors) provides following information on olfactory receptor (OR) sequences:
1.Sequence retrieval: Here user can retrieve sequences in fasta format of their interested organism.
2.Predicted TM boundaries: User can get information about predicted transmembrane domain regions with start and stop region of the full-length sequence. They are denoted as TM1 to TM7 for seven predicted helices. And the table with helix boundaries is colored by VIBGYOR colouring scheme, and when sequences were over predicted for more than seven TM-domains, cream colour is used. The sequences with less than seven predicted TM-domains can be also observed through the incompletion in VIBGYOR colouring scheme. The OR sequences chosen for 3-D modeling are emphasized with 'Yes' remark in the Structure column, which links out to the related structural information.
3.Intra and Inter-genome Alignments: Selected sequences at intra genomic and inter genomic association were aligned by MAFFT and the obtained MSA are made available for OR sequences from 5 organisms. Here user can also select combination of organisms to retrieve cross-genome alignments to study more on comparative genomics.
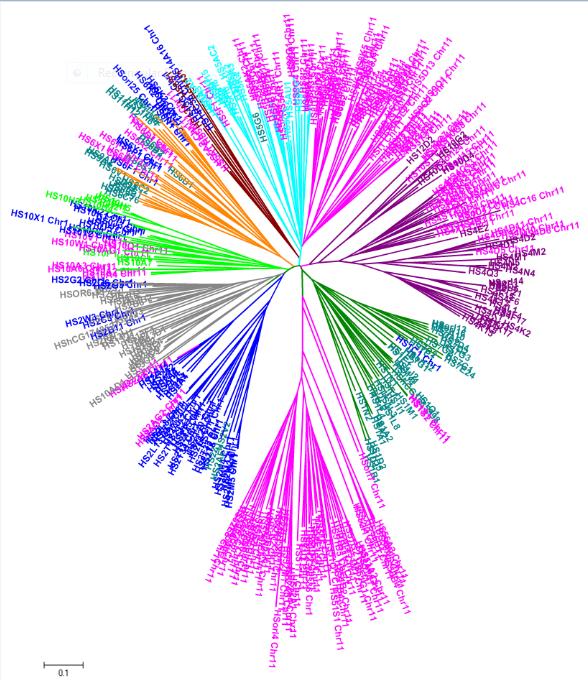
4.Cluster association and Phylogeny: The phylogenetic analysis at single genome level and cross -genome level provides knowledge on Clade distribution. By observing clades , related sequences were grouped as clusters and the cluster-wise distributed sequences were given in MSA . The generated phylogeny for all selected genomes at intra genomic and inter genomic association are made available .
The given flow-chart describes about the Steps ,Process and Tools involved in generating information on sequences in DOR (Database Of Olfactory Receptors)

This section dealing with OR sequences, helps user to retrieve ORs for 5 organisms, gives knowledge on associated homologs in cluster association, inter and intra genomic alignments, phylogeny and motif analysis(Tm-motif). This helps to address evolutionary integrity and species specificity. Certain sequence properties can be studied for their functional relevance within and across genomes and also for further 3-D modeling.
II. Notes on Olfactory Receptor Structures:
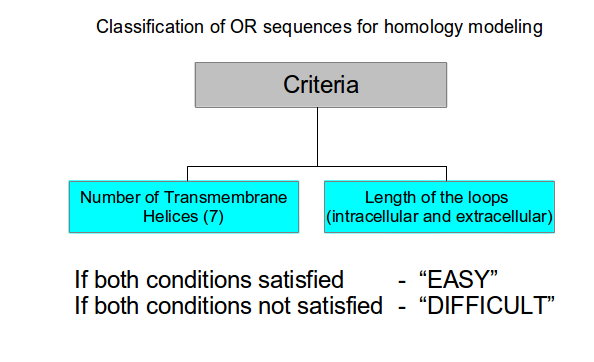
Sequences of OR proteins from Saccharomyces cerevisiae, Drosophila melanogaster, Caenorhabditis elegans, Mus musculus, and Homo sapiens were collected from phylogenetic analysis (unpublished data) . The sequences were classified into 'EASY' and 'DIFFICULT' as given in the flow chart below. Similar classification scheme was used for all 5 model organisms.

100 OR sequences were chosen from five model organisms after classifying them using the flow chart shown above as follows:
50 Homo sapiens OR proteins
30 Mus musculus OR proteins
5 Drosophila melanogaster OR proteins
13 Caenorhabditis elegans OR proteins
2 Saccharomyces cerevisiae OR proteins
The OR proteins were modelled (Comparitive modelling) using GPCR with highest sequence identity as template (see methodology):

Only sequences classified as 'EASY' were taken for first level of modeling. For every OR protein sequence wherever possible, active and inactive structures were modeled and following details have been incorporated in the structure information page for the respective OR sequence in DOR database.
1. PDB file of OR protein model
2. PSE (pymol session file) for VIBGYOR coloured OR protein model
3. Alignment file: Alignment between template and query where in TM domains are coloured in VIBGYOR
4. Validation sheet: The sheet contains data on procheck ramachandran plot analysis and energy values of the OR protein model.
5. Consurf results mapped on the OR protein sequence modeled.
6. Consurf results mapped on to the OR protein structural model.
7. Dimer interface prediction by method 1 and method 2 (as mentioned below)
III. Dimer Interface prediction for Mammalian Olfactory Receptor Structures:
Interfaces of olfactory receptors (ORs) were predicted by the method provided in G-protein coupled Receptor Interaction Partners (GRIP), which requires a three-dimensional structure of a target GPCR and its homologous sequences . In this work, we used a model structure of a target OR and the sequences that belong to the same subtype as that of the target. GRIP was developed based on three assumptions. Firstly, GPCRs form oligomers based on the domain-contact mechanism, which utilizes the lipid-facing molecular surfaces along transmembrane helices as the interfaces . Therefore, GRIP does not take into account the domain-swapping mechanism, which utilizes buried residues of a monomeric structure after the drastic conformational change of the structure ]. Secondly, the residues directly involved in the oligomerization are conserved within the subtype, to which the target belongs. Thirdly, the conserved residues would be more abundant at the interface than at the non-interface surface. Further details about these assumptions are described in the article about the method . Based on these assumptions, GRIP searches for the lipid-facing surfaces along transmembrane helices where a number of conserved residues are clustered with statistical significance. However, it was difficult to detect a cluster of conserved residues on the surface of the three-dimensional structure. Therefore, GRIP transformed the structure as follows. Roughly speaking, the monomeric structure of OR can be regarded as a thick tube, whose long axis is approximately perpendicular to the membrane plane. In this schematic image, all of the OR residues are regarded as constituents of the tube, and the interface residues are considered to cluster on a surface of the tube. If all of the residues are projected on the plane perpendicular to the long axis of the tube, then the projected residues form a ring-like distribution on the plane. Then, the interface residues would be clustered in a sector of the ring-like distribution. GRIP applied the principal component analysis to the Cartesian coordinates of the alpha carbons of OR. The first principal component vector runs along the long axis of the tube-like structure of the structure. Therefore, GRIP projected all of the residues on the plane defined by the second and third principal component vectors, and searched for a sector where the abundance of conserved residues was statistically significant in the ring-like distribution of the projected residues. The residues within the sector thus detected are considered to correspond to the residues constituting the interface.


