The database can be browsed in several ways
1. Using the superfamily code (5-6 digit SCOPe code). For example, “Bacterial luciferase-like” can be found as “51679”
2. Using the code of the domain i.e. SCOPe domain (a 7 digit code, example d1luca_ means chain A of the PDB structure 1luc forms corresponds to the domain bacterial luciferase alpha chain from Vibrio harveyi)
3. Search using the PDB ID (4 digit code) returns the superfamily (or superfamilies) which include(s) the domains coming from the PDB structure. Example, on searching for PDB structure 1luc, the two chains A and B, corresponding to d1luca_ and d1lucb_ are listed, which are the alpha and beta chains of the bacterial luciferase protein from Vibrio harveyi, both of which come under the superfamily 47565.
4. Search can also be performed using the key terms or full name of a superfamily or a fold. For example, entering the partial name as "bacterial" will list all superfamilies whose names contain the term “bacterial” and this would include 47565 or “Bacterial luciferase-like” superfamily
Features tab:
1. Matrices: The pairwise sequence identity between the members of the superfamily are provided as a percentage identity matrix (IDENT.mat) and pairwise sequence distances between two structures, calculated as (-100*ln(ID/100)) are provided as DIST.mat file. Both are calculated using the JOY4 program
2. PCA: Principal Component Analysis carried out using the pairwise sequence distances between the domain structures, derived from DIST.mat is provided in the file “PCA” and the plots are provided as PDB and PDF files (“PCA PDB” and “PCA PDF”)
3. CUSP results: Distantly related proteins adopt and retain similar structural scaffolds despite length variations that could be as much as two-fold in some protein superfamilies. CUSP (1), an in-house algorithm, was used to examine multi-membered PASS2 superfamily alignments to identify indel regions. The regions of conserved structure common to related proteins from structurally unconserved regions that vary in length and the type of structure are examined using CUSP and the input for this is the JOY4 file which contains structural annotation of the COMPARER-derived alignment. Consecutive positions with high scores are merged to identify structurally conserved blocks and distinguish them from indels. An average score is associated with each such block and used to annotate the alignment to distinguish indel regions (Structurally Unconserved Block or USB) from 'core' regions (Structurally Conserved Block or SSB) based on block scores as 'high, medium or poor' to indicate the degree of conservation. Highly conserved structural blocks (H, E and C) are identified by:
a. High (block score 4.5-5.0)
b. Medium (block score 3-4.5)
c. Poor (block score less than 3)
4. ALISTAT results: ALISTAT program reads the structure-based sequence alignment of a superfamily and shows simple statistics about the sane. These statistics include the name of the format, the number of sequences, the total number of residues, the average and range of the sequence lengths, the alignment length (e.g. including gap characters). A percent pairwise alignment identity is calculated as (idents/MIN(len1, len2)) where idents is the number of exact identities and len1, len2 are the unaligned lengths of the two sequences. The "average percent identity", "most related pair", and "most unrelated pair" of the alignment are the average, maximum, and minimum of all (N)(N-1)/2 pairs, respectively. The "most distant seq" is calculated by finding the maximum pairwise identity (best relative) for all N sequences, then finding the minimum of these N numbers (hence, the most deviant sequence)
5. SMotif results: A set of structural motifs from protein structures is identified from the alignment using the in-house tool SMotif (2), by recognising the conservation of amino acid preference and solvent inaccessibility and the conservation of other features like secondary structural content, hydrogen bonding and residue packing. A structural feature is considered as conserved at an alignment position if it is present in all or all but-one members within the alignment. The motifs are ranked by the extent of conservation of the structural feature. These structural motifs are listed in the PROSITE format and also are mapped on the alignment and these are available as a downloadable file for each superfamily
6. MeanRMS: This file contains the average Cα RMSD of each structure with respect to others in the superfamily, and is obtained from the final superimposed structure of all members of the superfamily which could be aligned using COMPARER
Members Tab:
Since the last update (PASS2.6) we have been marking protein domains which are structurally too deviant to be aligned with other members of the superfamily using COMPARER as “outliers” (“Outliers” tab) and these are listed alongside the domains (“Domains” tab) considered for the alignment. New PDBs which are obtained by searching latest release of PDB with members listed for a superfamily by SCOPe are listed in the “New PDBs” tab. This helps us with access to information about structures which may not yet have been included into SCOPe but are part of a particular superfamily.
Conserved Interactions Tab: Alignment of networks
Let us consider two networks.
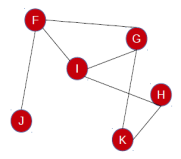 ABCDE
ABCDE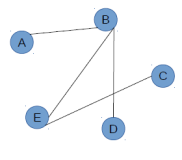
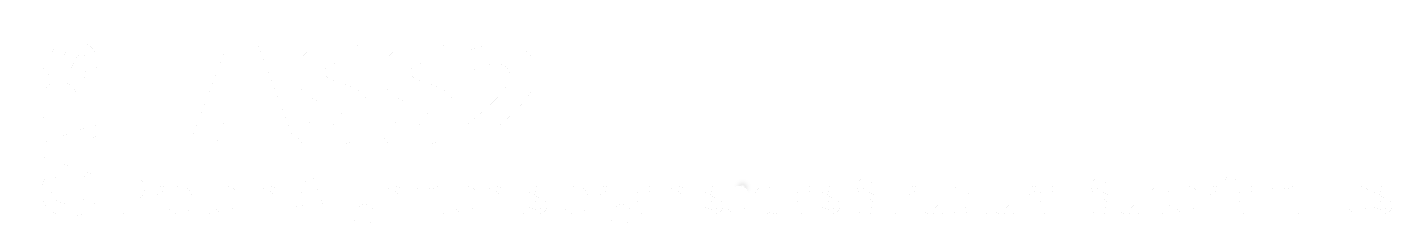
FGHIJK
Let the nodes in the networks have the following equivalence.
A - B - - C D E
- F G H I - J K
To align the two networks, both the networks are brought to the same size by adding dummy nodes at positions depending on the matching of the nodes. Nodes in the new networks can be shown as follows:
Position number 1 2 3 4 5 6 7 8
A X B X X C D E
X F G H I X J K
The node that has a match in the other network is aligned with the matched node. The ones that do not have a match are aligned with dummy nodes in the other network. The edges between the nodes in each network are retained as such and the dummy nodes that are inserted do not have any edges with any nodes. The aligned networks are:
Conserved edges
An edge is said to be conserved when it is aligned between the nodes in the same position. For example, edge B-E in first network and edge G-K in second network are aligned. That means, there is conservation of edge between position 3 and position 8.
Protein Structure Networks
Interactions between the residues in a protein can be studied at various levels using networks.
1. Backbone:
Two residues are said to interact when their c-alpha atoms are within a distance of a particular cutoff value. In this study, 7.5Å is used as cut-off. A Backbone network is constructed with residues as nodes and interactions depicted as edges among these nodes.
2. Sidechain:
Two residues are considered to have atom contact when any of non-heavy atoms (all atoms except N,Cα,C and O) of the residues are within a distance of 4.5 Å. A sidechain network is constructed with residues as nodes and edges are constructed whenever at least one atom contact exists between corresponding residues.
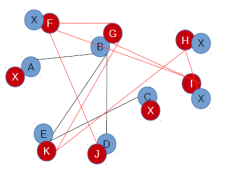
Absolutely Conserved Interactions or ACIs for a superfamily:
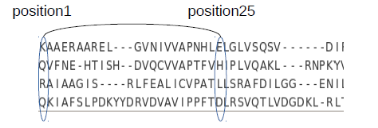
A sample COMPARER-derived alignment for members of a superfamily is shown below:
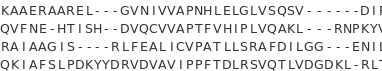
Networks (backbone/sidechain) for all the members in a superfamily are constructed and are aligned according to the COMPARER alignment. Edges that are common among all the members of the superfamily are identified as Absolutely Conserved Interactions (ACIs) and an example of the same is as follows:
The results of the graph theoretical analysis on each superfamily that have been made available for download as a zipped file are:
1. *.bb.ACI: Absolutely conserved interactions of the backbones of residues
2. *.sc.ACI: ACIs of sidechains of residues
3. *.bbsc_common_ACI: ACIs that are common to the backbone and the sidechain of residues
4. *.bb.ACI.png and *.bb.ACI.pse are image and PyMol session files made available for user to view the backbone ACIs plotted on the superimposed structure of all members of the superfamily
5. *.sc.ACI.png and *.sc.ACI.pse are image and PyMol session files made available for user to view the sidechain ACIs plotted on the superimposed structure of all members of the superfamily
6. *.bbsc.ACI.png and *.bbsc.ACI.pse are image and PyMol session files made available for user to view the ACIs common to backbone and sidechain, plotted on the superimposed structure of all members of the superfamily
7. *.bb.ACI.network.png and *.bb.ACI.network.pse are image and PyMol session files that contain the first structure in the superfamily showing backbone ACIs along with residues labelled with the list of residues in that position in all members of the superfamily
8. *.sc.ACI.network.png and *.sc.ACI.network.pse are image and PyMol session files that contain the first structure in the superfamily showing sidechain ACIs along with residues labelled with the list of residues in that position in all members of the superfamily
9. *.bbsc.ACI.network.png and *.bbsc.ACI.network.pse are image and PyMol session files that contain the first structure in the superfamily showing ACIs which are common between backbone and sidechain networks, along with residues labelled with the list of residues in that position in all members of the superfamily
Format of ACI results file:
position1 position 2 number_of_structures_in which_this_edge_is_retained
eg:
22 65 10
26 61 10
32 58 10
Improvement of alignment quality using unsupervised machine learning:
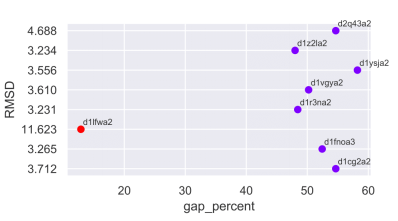
In certain cases (< 10% of the total number of multi-membered superfamilies in PASS2.7) the COMPARER alignment obtained may contain several gaps owing to high Cα-RMSD of a member or stark difference in length of member(s) from others in the superfamily. In this update we have tried to objectively identify such member(s) in an automated manner by clustering the domains used for creating the alignment. To estimate the optimal number of clusters, we have used an unsupervised machine learning (K-means) for clustering with the elbow method algorithm. The features given for clustering included the percentage of gaps contributed by each member to the alignment, the Cα-RMSD and the length of each member. By identifying the clusters, we have either trimmed a giant member (a domain contributing large overhangs to the alignment) or removed dwarf domains (shorter in length compared to other members) or split superfamilies as per clusters predicted, to avoid losing out on number of members of a superfamily. Example, in the case of the superfamily 55031, the domain d1lfwa2 not only is a giant member (causing all other members to contribute a large number of gaps) but it also has a high Cα-RMSD compared to other members. Once this member was removed, the alignment quality improved dramatically.
1. Sandhya,S., Pankaj,B., Govind,M.K., Offmann,B., Srinivasan,N. and Sowdhamini,R. (2008) CUSP: An algorithm to distinguish structurally conserved and unconserved regions in protein domain alignments and its application in the study of large length variations. BMC Structural Biology, 8.
2. Pugalenthi,G., Suganthan,P.N., Sowdhamini,R. and Chakrabarti,S. (2007) SMotif: A server for structural motifs in proteins. Bioinformatics, 23, 637–638.