Help Section
Frequently asked questions (FAQs) and step-by-step tutorials.
This database brings together data from several sources, and the graphs reflect the data in those sources at the time of import. If a node or a connection seems to be missing, it usually means it was absent in the original sources, or that we were unable to reliably link them. For the most complete details, please check the original sources. You can also contact us or fill out the feedback form (details are available on the 'About us' page).
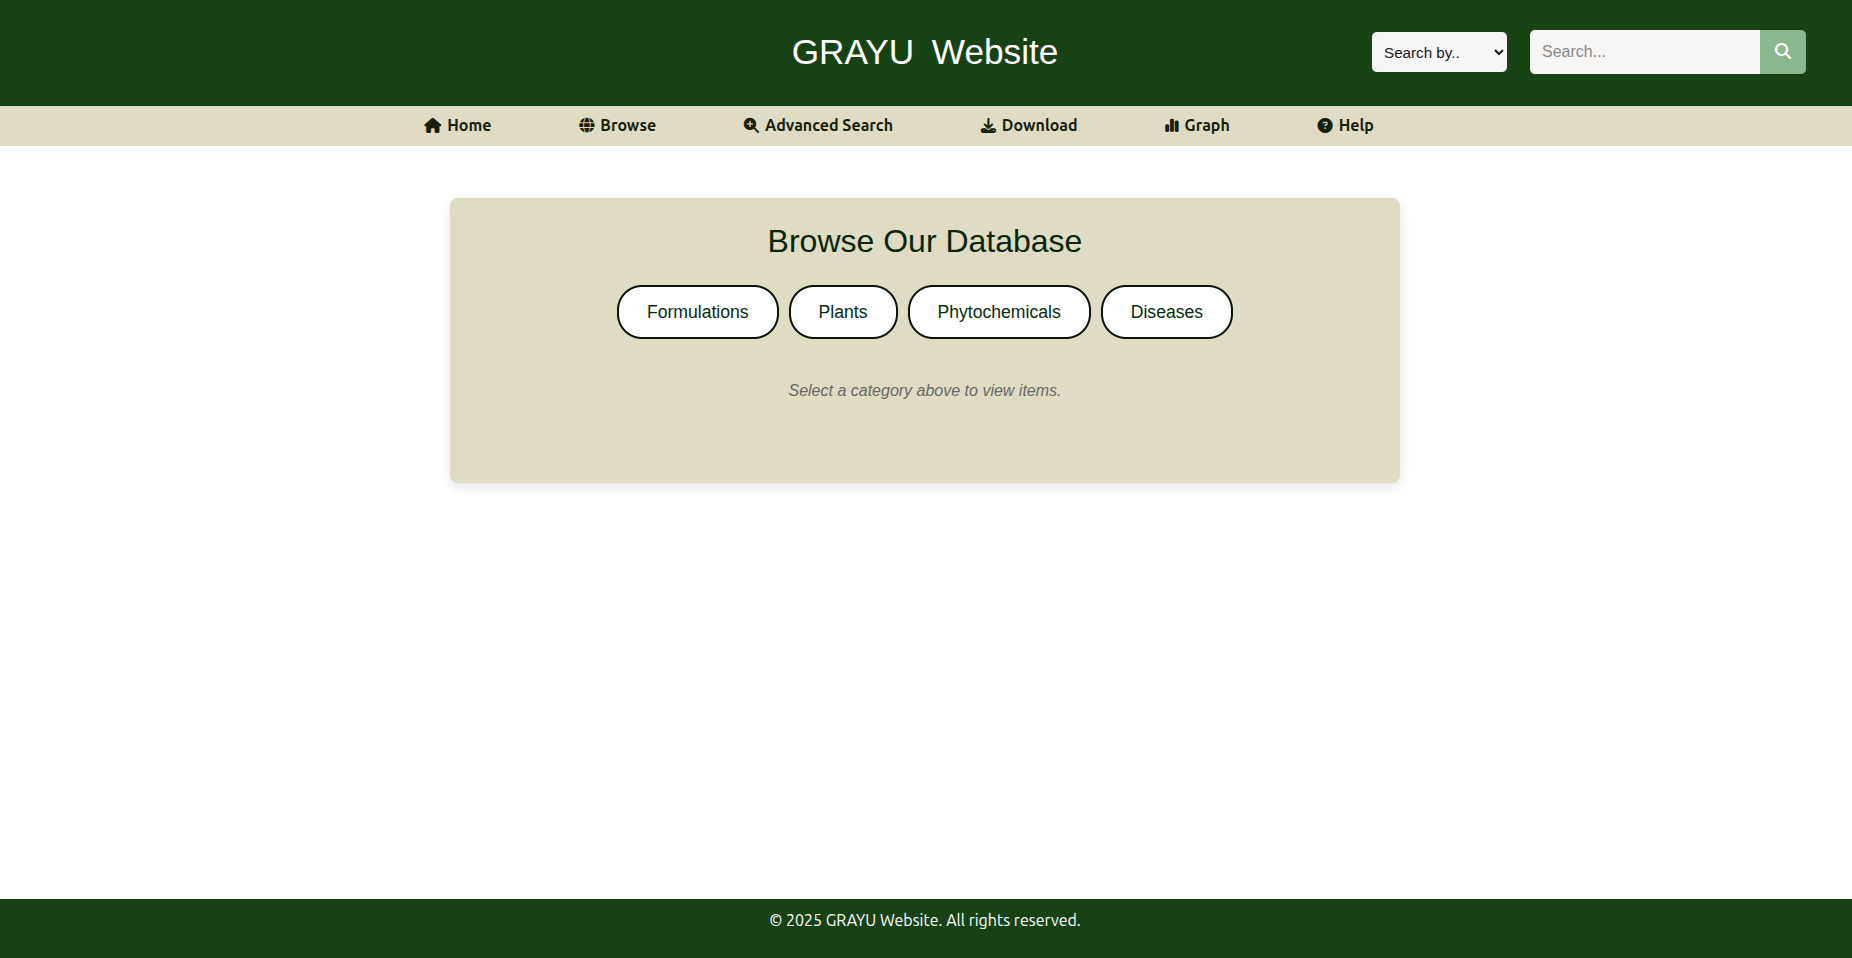
The Home page is the main portal to our website. It provides an overview and quick access to key features.
Key Elements:
- Search Bar:
The search bar featured on the home page allows you to quickly search for any element across all categories: formulations, plants, diseases, and phytochemicals.
The search also returns results for partial matches.
You can also select a specific category from the dropdown to narrow your search.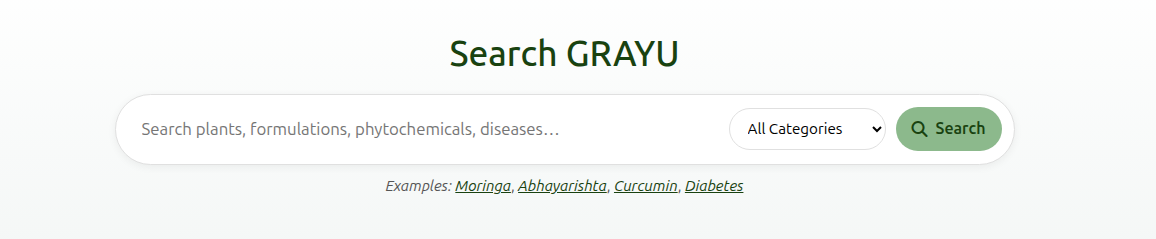
The search will match results based on the following criteria:- Formulations: Matches against formulation name.
- Plants: Matches against scientific names and common plant names/synonyms.
- Diseases: Matches against disease name, DOID label, and the disease node ID.
- Phytochemicals: Matches against compound name, IUPAC name, and PubChem CID.
Please note that the search term must be at least 4 characters long to initiate a search for formulations, plants or diseases. For phytochemicals, the search term may be as short as 1 character, since the search results may match phytochemicals with PubChem CIDs that are numeric and can be as short as a single digit.
Example searches are also provided below the search bar to help you get started. Click on any example to auto-fill the search bar and see results. For example, clicking on 'Moringa' will populate the search bar with 'Moringa' and display relevant results. The category of each search result is also mentioned above the result in capital letters.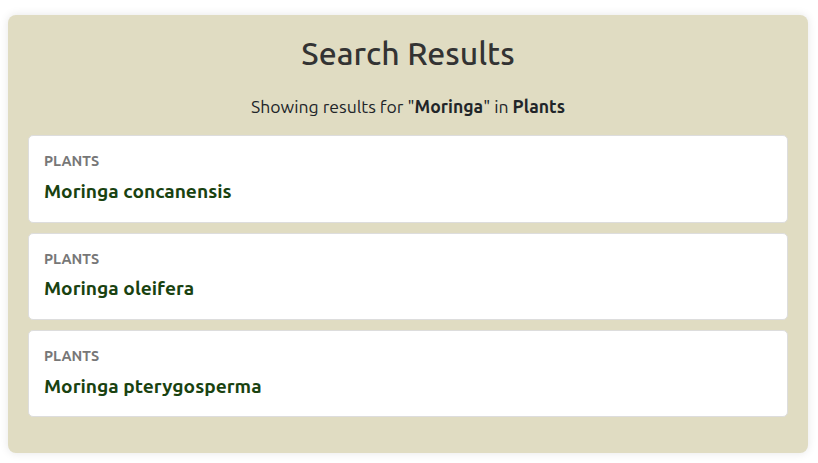
The same search bar is also included in the header for easy access from any page.
Similarly, searching the term 'ashwagandha' in the search bar without selecting a specific category will return results for all categories that match the term. In this case, it will return results for the plant with of the same common name, as well as multiple formulations and a phytochemical that include the word in the name. Here is an example screenshot: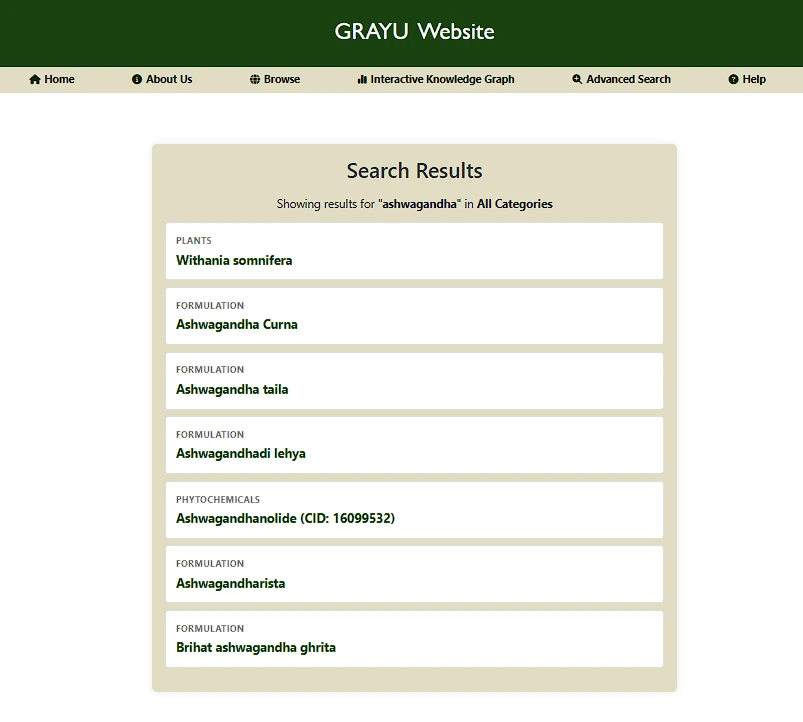
- Navigation Bar: Located at the top, it allows you to easily move to other sections like Browse, Advanced Search, Download, Graph and Help.

- Home: This button returns you to the home page.
- About Us: Here you can find information about the website and our team, including contact details. The page also includes a feedback form for suggestions/comments.
- Browse: Takes you to the Browse page where you can explore data by category: formulations, plants, diseases, and phytochemicals.
- Interactive Graph: Leads to the graph page, where the data is presented as a knowledge graph and can be browsed interactively.
- Advanced Search: Opens the Advanced Search page for building complex queries.
- Download: Directs you to the Download section to access datasets.
- Help: Opens this Help Section for guidance and FAQs.
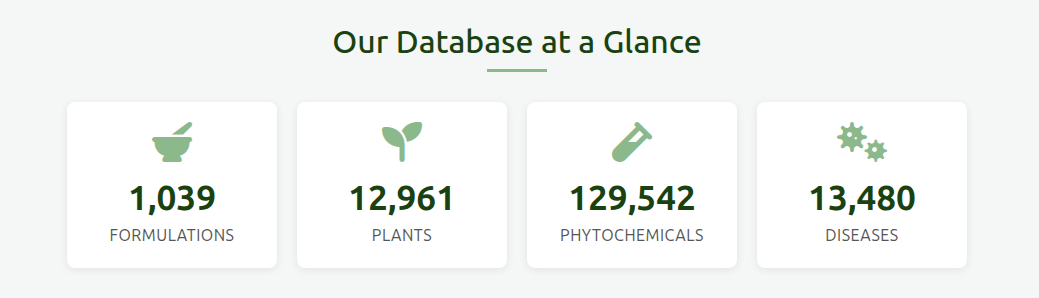
- Statistics Bar: Gives a count of the data collected in our GRAYU Database. Clicking on any of the tiles will take you directly to the Browse Page of that particular category.
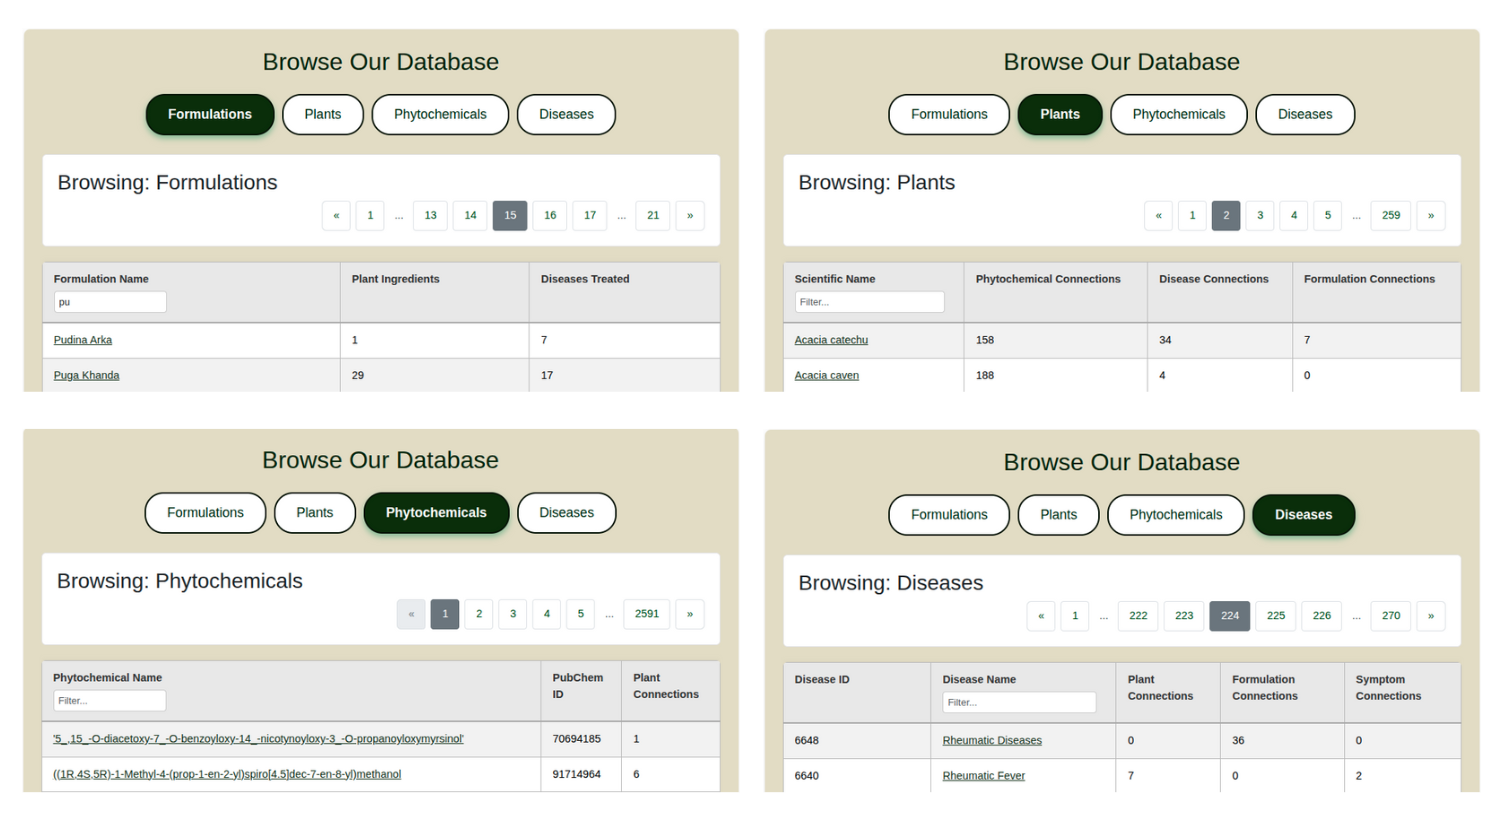
The Browse Page is where you can explore data category-wise. The data is organized into four categories: Formulations, Plants, Phytochemicals and Diseases.
You can watch the video below, or follow the instructions provided after the video to see how to navigate the Browse Page.
To view a particular element from a category:
-
Select the appropriate category: You will see a table displayed with the relevant data sorted alphabetically, with each page containing fifty results.
Pagination controls are available at the top and bottom - you can select the page you want to view, or use the double-arrows to move to the first or last page.
You can also use the filter to search for results on the current page.
Each category displays specific properties relevant to that category:
- Formulations displays the number of plant ingredients and disease associations for each formulation
- Plants displays the number of phytochemical connections, disease connections, and formulation connections for each plant
- Phytochemicals displays the PubChem ID and plant connections for each phytochemical
- Diseases displays the number of plant connections, formulation connections, and symptom connections for each disease
-
Find the specific element: Browse through the category pages to locate the element you are interested in.
For example, to find the formulation 'Draksavaleha', navigate to the Formulations category, and browse through the list of formulations. In this case, the formulation is located on page 5. You can use the filter to search for the formulation within the page.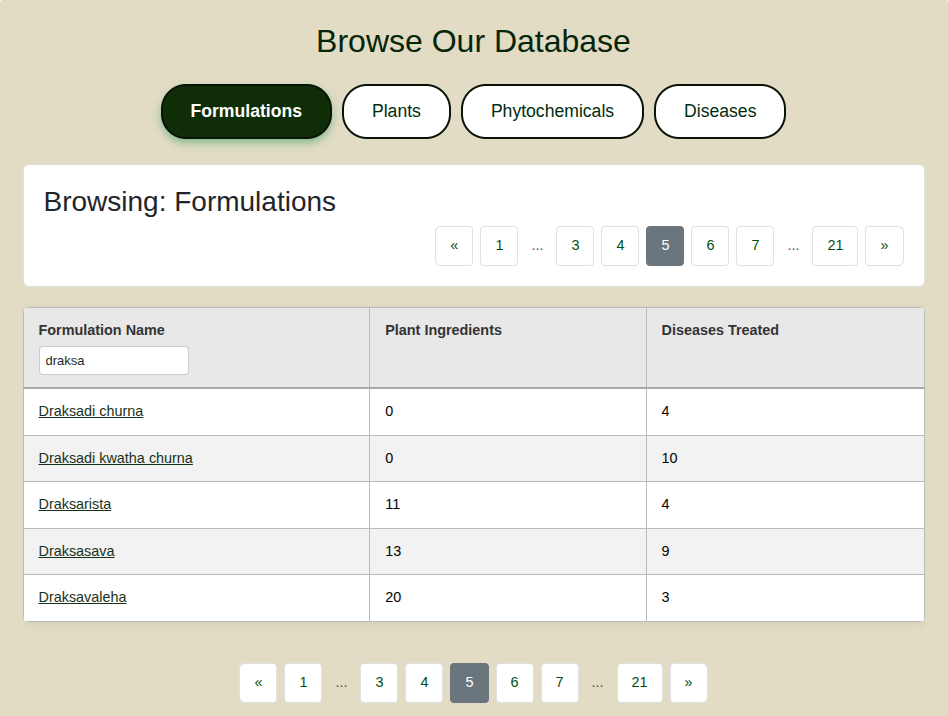
-
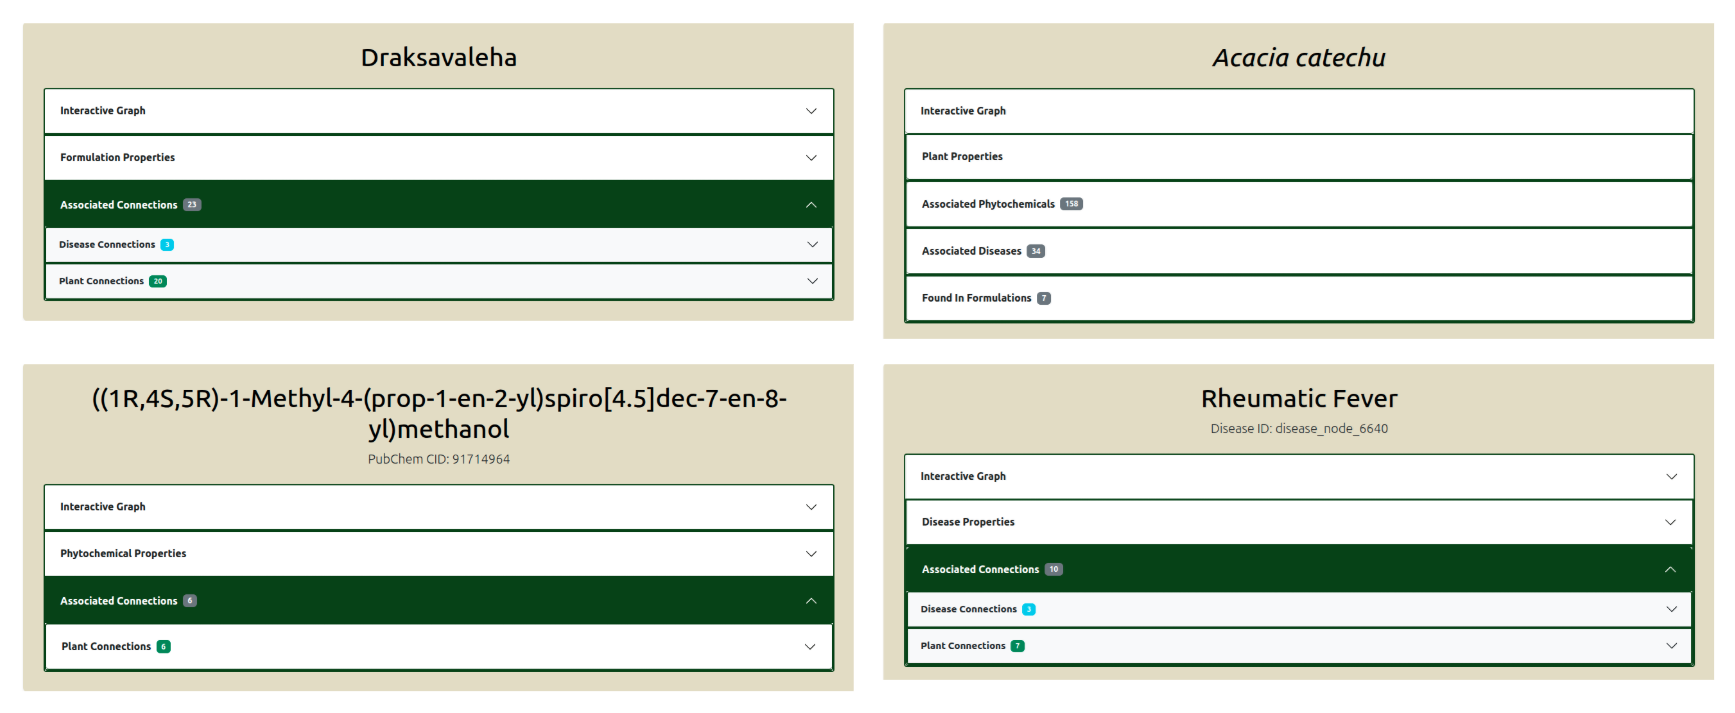
Explore the graph: The first accordion displays the graph with its associated connections in the form of nodes.
The default number of viewable connections is set to 10. You can modify the number of connections for each category and update the graph using the controls.
You can click on the nodes and move them around for better visibility. You can also click on the white background and drag the entire graph to reposition it.
-
Use the zoom buttons to control size of the graph The '+' button increases size of graph by zooming in, the '-' button decreases size of graph by zooming out,
and the third button resets the graph to default size.

-
Properties and Associated Connections: The properties of the selected node, as well as its connections to other entities in the graph, are displayed inside the following accordions.
The accordions can be clicked and expanded to view the details. A hyperlink to the properties table detailing the description of each property is also provided within the category properties accordion.
Example screenshots for one node in each category are shown below.
Buttons to navigate back to the Browse page or to the Home page are also provided at the bottom of the page for your convenience.
The Interactive Knowledge Graph allows you to explore the relationships between Ayurvedic formulations, plants, diseases, and phytochemicals seamlessly in a visual format.
The graph is interactive, enabling you to click on nodes to view their properties and connections, expand or collapse sections, and navigate through the data intuitively.
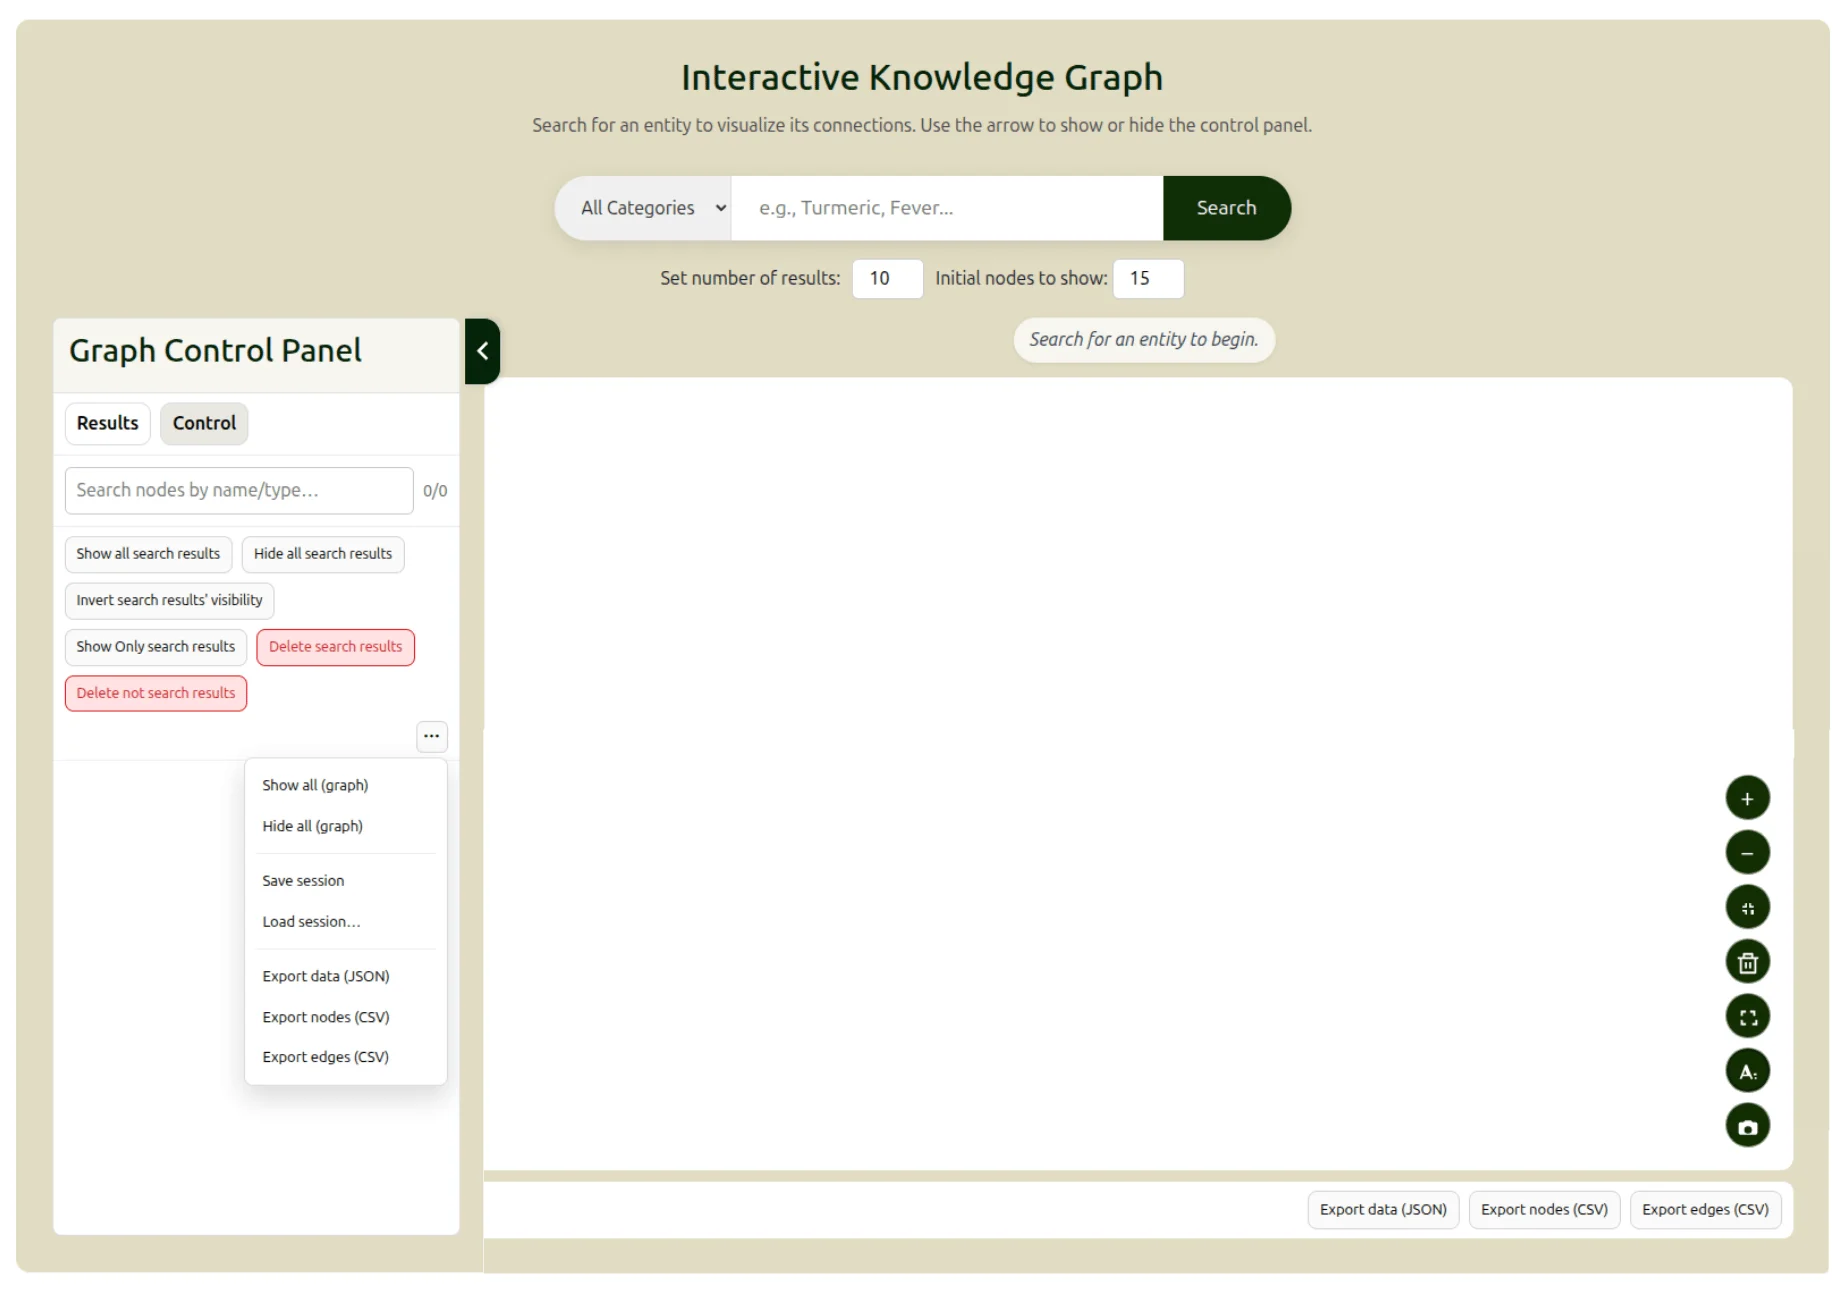
As in the screenshot below, you can click on the green arrow to expand or collapse the graph Control Panel on the left side of the page.
You can also set the number of results to be displayed, and the number of nodes to be viewed in the graph pane, using the controls placed above the graph.
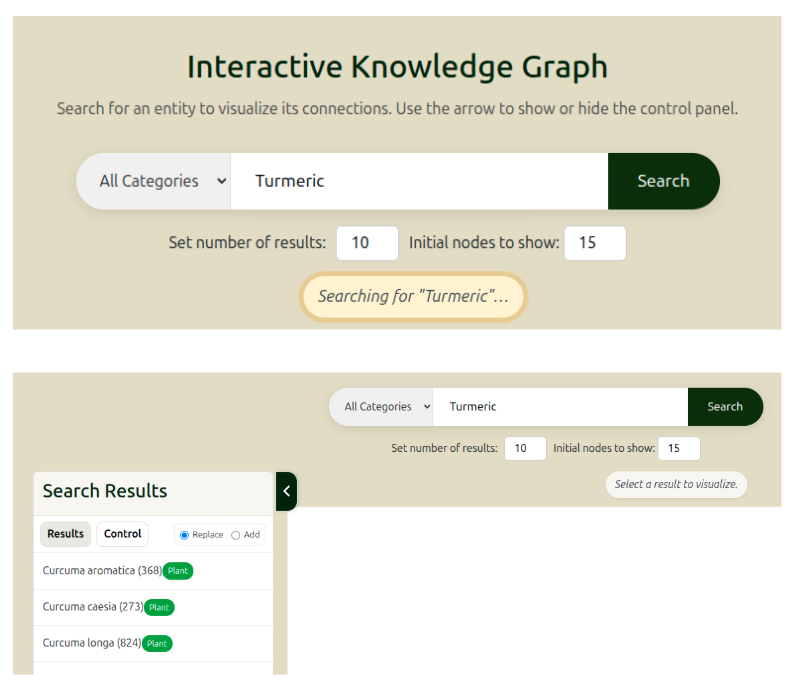
To search, we can type in the name of a formulation, plant, disease or phytochemical in the search bar and click on the search icon.
Selecting the relevant category from the dropdown will narrow the search to that category, and speed up the search process.
The text above the graph indicates the process that is currently taking place, and flashes with information regarding any changes to the graph when the graph has been updated.
Basic Controls
As observed in the screenshot above, there are several controls available to customize the graph view, as well as to save or export the graph.
Hovering over each control will display a tooltip describing its function. These controls are described below:
- Viewing the Graph:
Controls in the bottom right corner of the graph allow you to set the view in the graph pane.
- Zoom In (+): Click this button to zoom in and get a closer view of the graph.
- Zoom Out (-): Click this button to zoom out and see a broader view of the graph.
- Reset View: Click this button to reset the graph to its original view and position.
- Clear Graph: Click this button to clear all nodes and edges from the graph. You can start a new search or load a saved graph.
- Fullscreen: Click this button to view the graph pane in fullscreen mode. While nodes and edges cannot be added in fullscreen mode, you can still interact with the graph to reposition nodes. You can also take screenshots by pressing PrtScn (or an equivalent shortcut) on your keyboard.
- Toggle labels: Click this button to hide or show all node labels in the graph.
- Download PNG (current view): Click this button to download a PNG image of the current graph view.
- Using the Graph Control Panel: This set of controls allows you to customize the graph by adding nodes, setting the number of connections to display, and exporting the graph.
- Search nodes by name/type: This input field allows you to filter the nodes displayed in the graph by their name or type.
- Show all search results: Click this button to display all nodes that match the current search criteria. The default number of displayed nodes is 15.
- Hide all search results: Click this button to hide all nodes that match the current search criteria. The results will be still be visible in the left panel.
- Invert search results' visibility: Click this button to invert the visibility of all nodes that match the current search criteria - all hidden nodes will be displayed, and all nodes that were initially visible will be hidden.
- Show only search results: Click this button to display only the nodes that match the current search criteria, hiding all other nodes.
- Delete search results: Click this button to delete all nodes that match the current search criteria This action will also remove these results from the left panel.
- Delete not search results: Click this button to delete all nodes that DO NOT match the current search criteria This action will also remove these results from the left panel.
- Find Common Nodes: Click this button to find nodes that are connected to a specific set of selected target nodes.
The button with three dots, located below these options, opens a menu with additional controls:
- Show all (graph): Click this button to display all nodes and edges in the graph.
- Hide all (graph): Click this button to hide all nodes and edges in the graph.
The menu also contains the following options for session management and data export, which are additionally available as separate buttons below the graph pane.
- Save session: Click this button to save the current state of the graph as a JSON file, including all nodes, edges, and their layout. This allows you to reload the graph later and continue your exploration from where you left off.
- Load session: Click this button to load a previously saved graph session.
- Export data (JSON): Click this button to export the current graph data as a JSON file. This will only save the nodes and edges.
- Export nodes (CSV): Click this button to export the visible nodes as CSV files.
- Export edges (CSV): Click this button to export the visible edges as a CSV file.
An Example Query (with Video)
Let's say you want to find compare between different varieties of Turmeric.
You can watch the video below, or follow the instructions provided after the video to see how this can be done using the Interactive Knowledge Graph.
You would begin by entering 'Turmeric' in the search bar. Additionally, you could also select 'Plant' from the dropdown menu.The bar above the graph flashes while the search is ongoing (as seen in the screenshot below). The search will return all plants with 'Turmeric' in their scientific or common names. In this case, the search returns three different varieties of Turmeric in alphabetical order: Curcuma aromatica, Curcuma caesia and Curcuma longa. The graph control panel on the left displays these results along with two options:
- Replace: This is the default. This option replaces the current graph (if available) with the selected search result.
- Add: This option adds the selected search result to the current graph (if available).
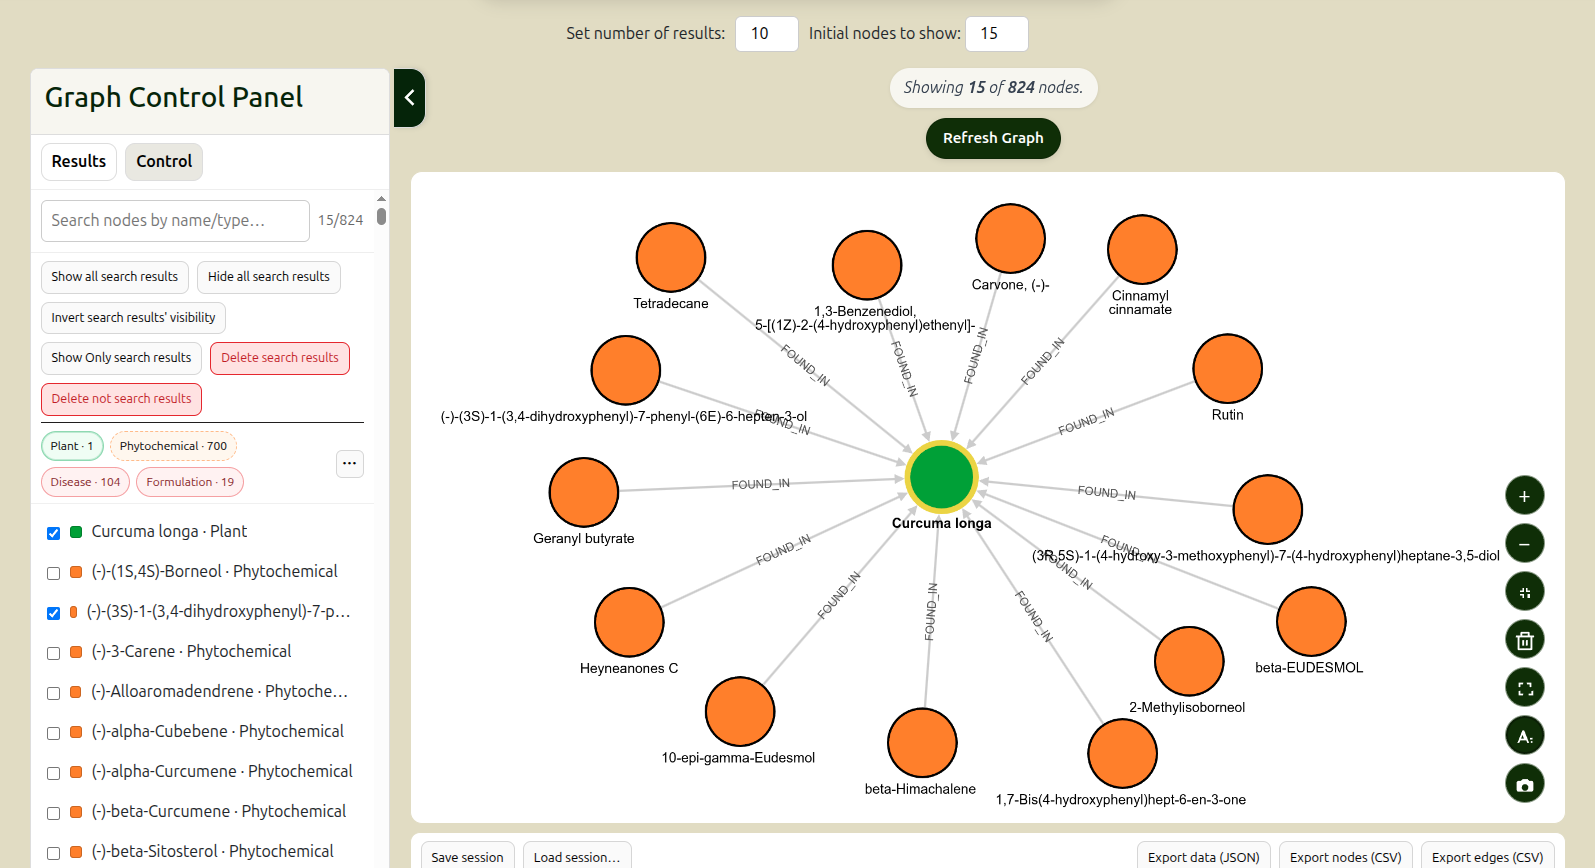
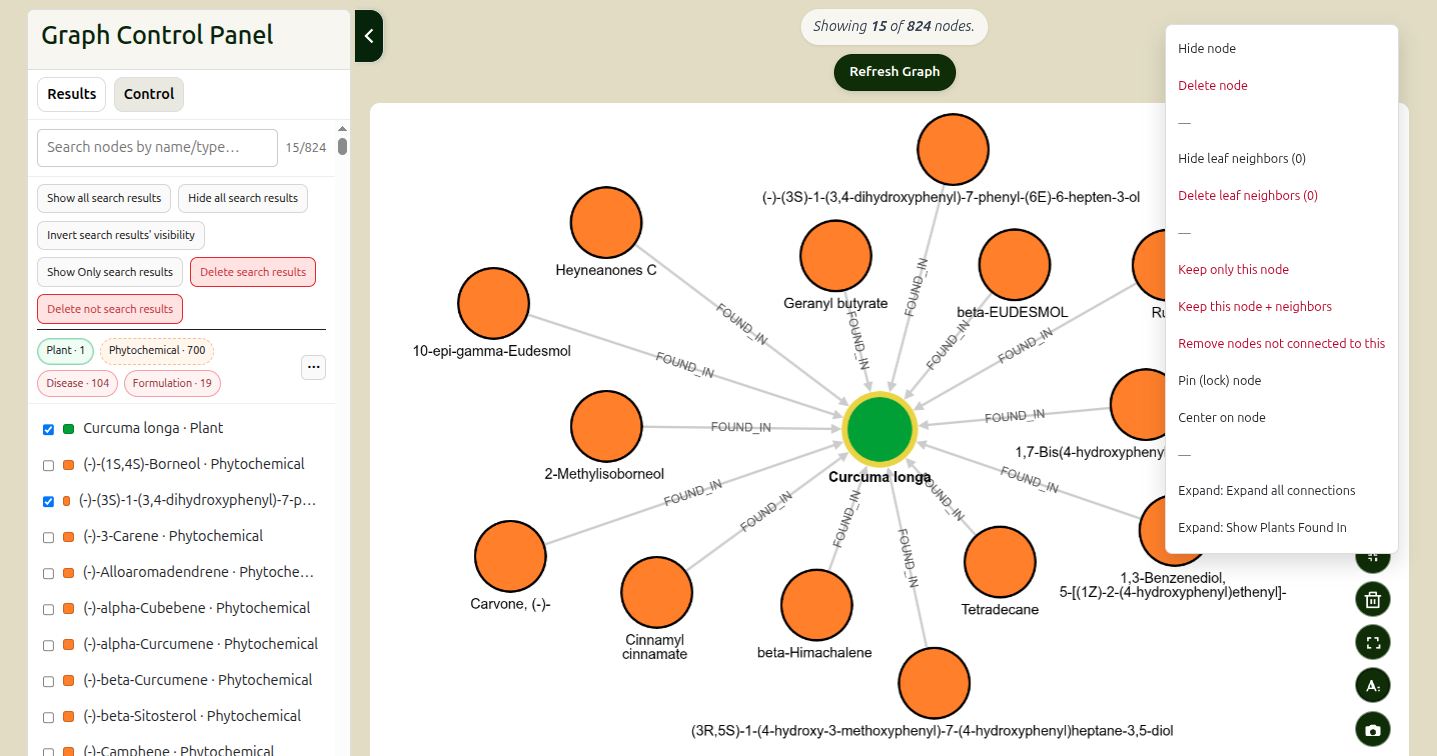
Clicking on the result for Curcuma longa displays the graph with Curcuma longa as the central node. All nodes are color-coded based on their category - formulations (blue), plants (green), diseases (red), and phytochemicals (yellow) - and can be dragged and repositioned for better visibility.
- As seen from the control panel, Curcuma longa is one plant node, with connections to 700 phytochemicals, 104 diseases, and 19 formulations. Clicking on any of these buttons will toggle visibility of nodes of that category in the graph.
- The Graph Control Panel also lists all the connected nodes and their categories. The blue tick mark indicates that the respective node is visible in the graph. Clicking on it will toggle graph visibility for that node.
- The top of the page shows that the graph displays 15 out of 824 total nodes (the 14 nodes shown are selected randomly). This number can be changed using the input fields above the graph.
- The Refresh Graph button re-initializes the graph, and can be used at any stage.
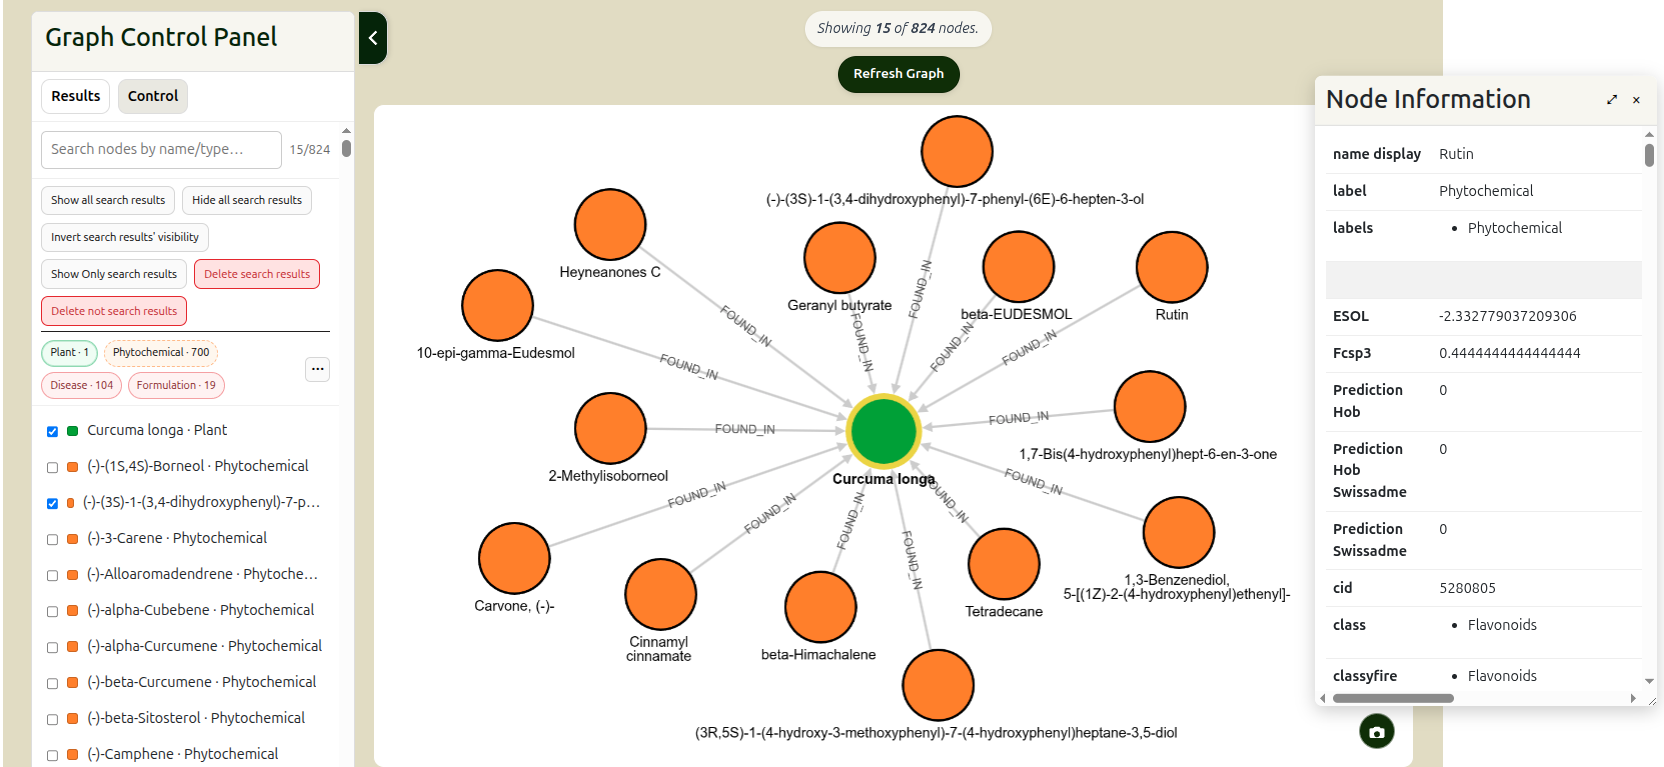
Left-clicking on any of the nodes will display its properties. For example, left-clicking on the node for Rutin shows all information associated with the node.
You can also right-click on any node to view a context menu with additional options (shown in the screenshot below):- Hide node: This option hides the selected node from the graph.
- Delete node: This option removes the selected node from the graph and the search results. Searching for the deleted node in the 'Filter' input field in the Graph Control Panel will not yield results.
- Hide leaf neighbours: This option hides all leaf neighbours of the selected node from the graph. It also displays the number of leaf nodes of the selected node.
- Delete leaf neighbours: This option removes all leaf neighbours of the selected node from the graph and the search results. It also displays the number of leaf nodes of the selected node.
- Keep only this node: This option removes all other nodes from the graph and the search results, keeping only the selected node.
- Keep this node + neighbours: This option keeps only the selected node and all its immediate neighbours in the graph and search results, removing the rest.
- Remove nodes not connected to this: This option removes all nodes that have no direct or indirect connections to the selected node.
- Pin (lock) node: This option pins (locks) the selected node in place, preventing it from being moved.
- Center on node: This option repositions the selected node to the center of the graph.
- Expand: This option expands all connections depending on the selected option - you can expand all connections so all connected nodes can be viewed in the graph, or you can expand only the connections of a particular category.
You can continue to explore the graph by clicking on other nodes, using the search bar to find specific nodes, or adjusting the number of nodes displayed using the controls above the graph. The graph is dynamic and will update based on your interactions, allowing you to delve deeper into the relationships between different entities in the database.
In order to compare two types of turmeric, we can add another turmeric variety to the graph. Say, we want to add Curcuma aromatica. We can go back to the 'Results' section in the Graph Control Panel, choose the 'Add' option, and select Curcuma aromatica from the list. This will add Curcuma aromatica to the existing graph with Curcuma longa.
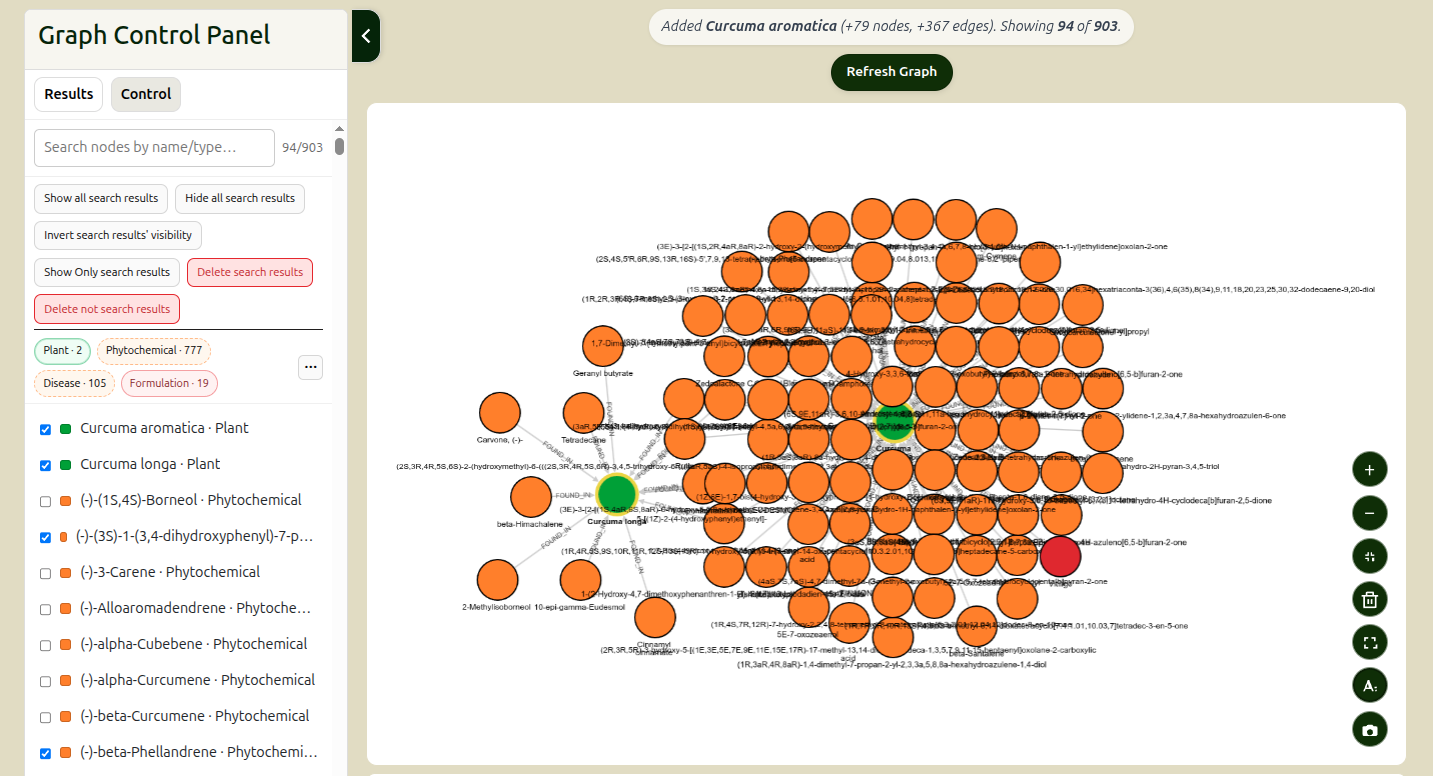
The updated graph now displays both turmeric varieties, allowing us to compare their phytochemical profiles and other connections. The bar on top also displays the number of nodes and edges that have been added to the graph.
Say we want to find the phytochemicals that are common to both turmeric varieties. We can do this by right-clicking on the node for Curcuma longa and selecting the option to 'Delete all leaf neighbours'. We will repeat this for Curcuma aromatica as well. This will retain both turmeric varieties and their connected phytochemicals, while removing all other nodes from the graph.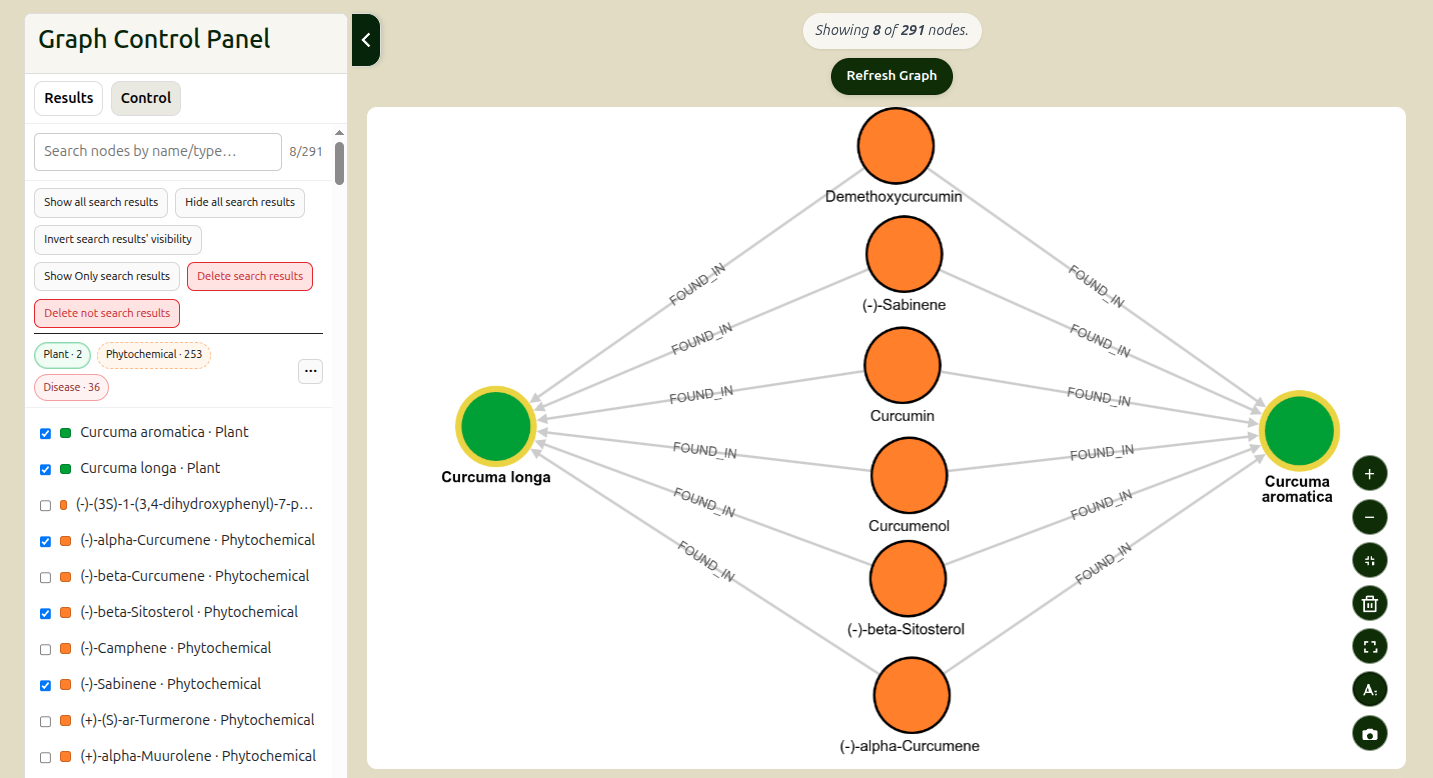
As seen in the screenshot above, the graph now displays both turmeric varieties and their common connections. There are 253 phytochemicals and 36 diseases that are connected to both turmeric varieties, as indicated in the Graph Control Panel. Out of these, 6 selected phytochemicals are visible in the graph.
Finding Common Nodes
A more powerful way to discover connections between specific nodes is by using the Find Common Nodes tool. You can access this tool from the Graph Control Panel.
Clicking the 'Find Common Nodes' button opens a modal where you can select two or more target nodes from the currently loaded graph. If you have already selected nodes directly on the graph (by holding Shift and clicking), they will be pre-checked for you.
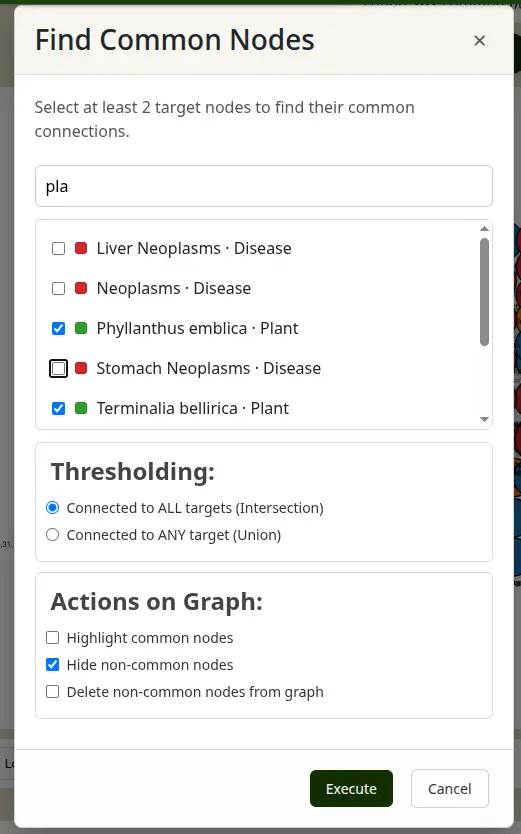
Inside the modal, you have several options to customize your search:- Thresholding: You can choose to find nodes that are connected to ALL of your selected targets (Intersection) or to ANY of your selected targets (Union).
- Highlight common nodes: Applies a distinctive glowing highlight to all discovered common nodes on the graph.
- Hide non-common nodes: Temporarily hides any nodes that are not part of your selected targets or their common connections, cleaning up the graph view.
- Delete non-common nodes from graph: Permanently removes all non-relevant nodes from the current graph layer.
This tool is especially useful for quickly identifying shared ingredients between different formulations, or shared phytochemicals across various medicinal plants.
Advanced Search allows you to construct powerful, precise queries by combining multiple search criteria. This is ideal for finding specific data that meet several conditions at once.
Important: All filters you add are combined using AND logic. This means an entry must match all of your specified criteria to appear in the results.
Property Definitions
To build an effective query, it is helpful to know which properties are available for filtering. The button below reveals a reference table of all searchable and viewable properties for each entity in the database.
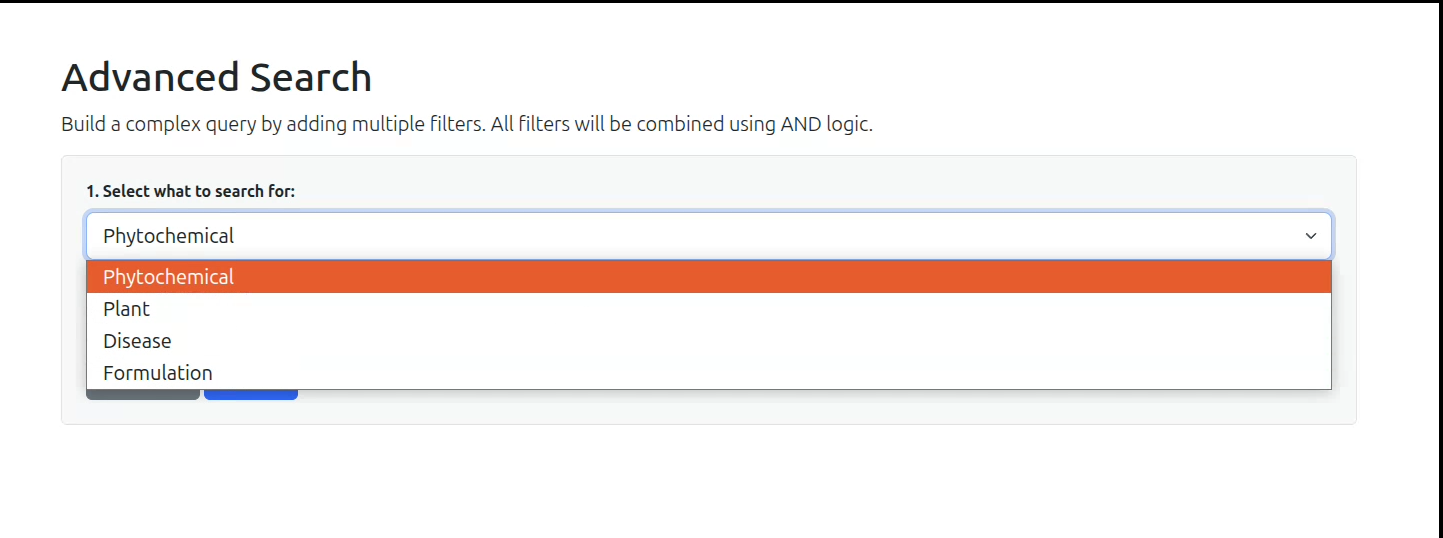
Step 1: Select Your Search Target
The first step is to chSoose the category of data you want to search for from the main dropdown menu. Your options are:
- Phytochemical
- Plant
- Disease
- Formulation
Selecting an entity here will determine which properties are available in the filter rows below.
Step 2: Build Your Query with Filters
Each filter is a single condition that you add to your query. A filter row consists of three parts:
- Property: The specific data field you want to search (e.g.,
Molecular Weight,Family Name,Dosage Form). A hyperlink to the Properties reference table is provided for user reference. - Operator: How you want to compare the property (e.g.,
contains,>=,is present). The available operators will change automatically based on the type of property you select (text, numeric, or boolean). - Value: The value you are searching for. This field will disappear if the operator doesn't require a value (for example:
is present).
Use the button to add more criteria, and the button to remove any filter row.
You can also filter by connections to other graph entities. For example, if you are searching for Plants, you can add optional filters to only show those that are associated with phytochemicals, formulations and diseases matching certain criteria.
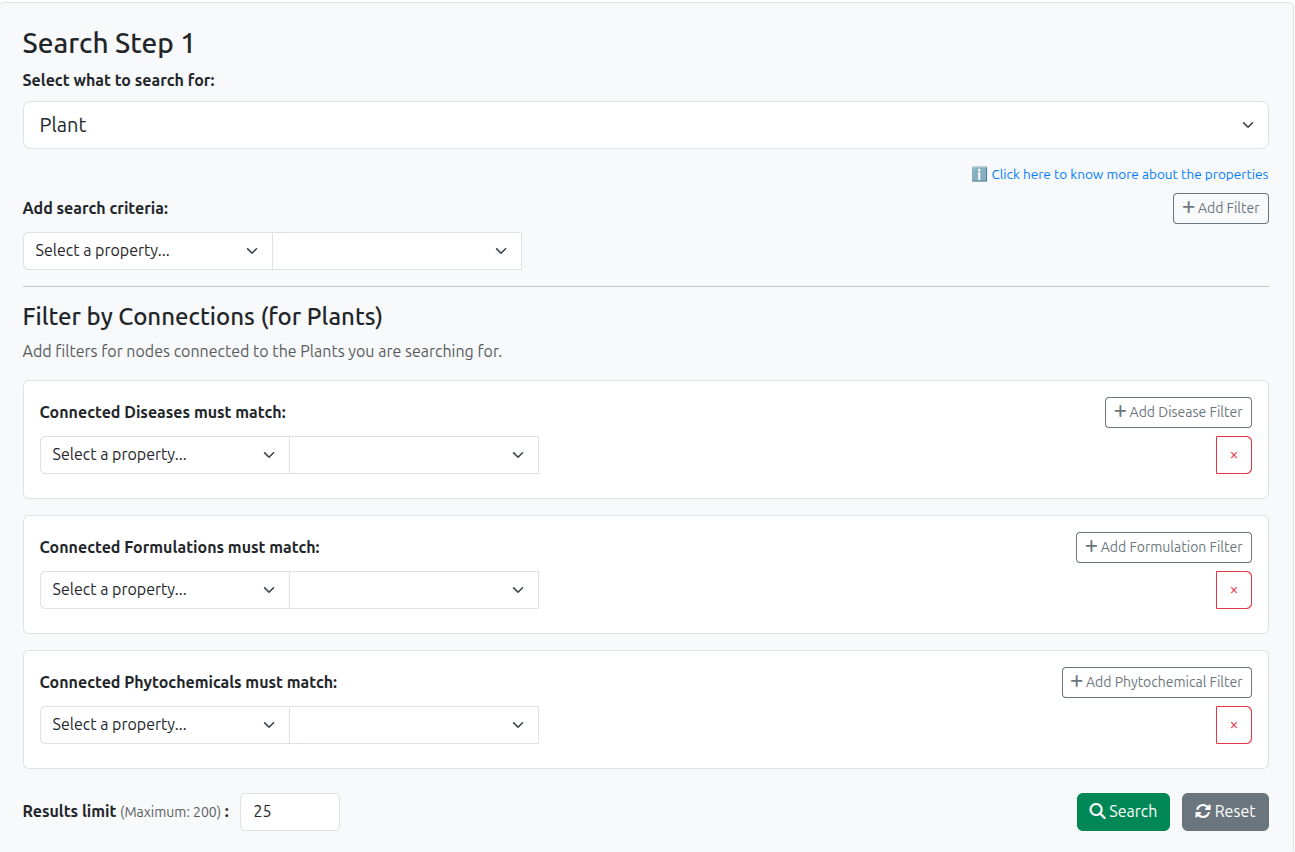
The search results are limited to 25 entries by default, but the limit can be increased up to 200 by entering the required number of results in the 'Results limit' field.
For a better understanding of the features of Advanced Search, please refer to the example query in the following section.
An Example Query (with Video)
Let's say you want to find all Phytochemicals that are highly soluble and also considered "drug-like".
You can watch the video below, or follow the instructions provided after the video to see how this can be done using the Advanced Search feature.
You would build a query with two filters:
- Property:
ESOL, Operator:>=, Value:-4 - Property:
Lipinski Rule Of 5, Operator:is true
This query will only return phytochemicals that satisfy both conditions simultaneously.
Once you have built your query, click the button. The results will appear in a table at the bottom of the page. If your query returns nothing, a "No results found" message will be displayed. The search can be completely cleared at any stage by clicking on the 'Reset Entire Search' button at the bottom.
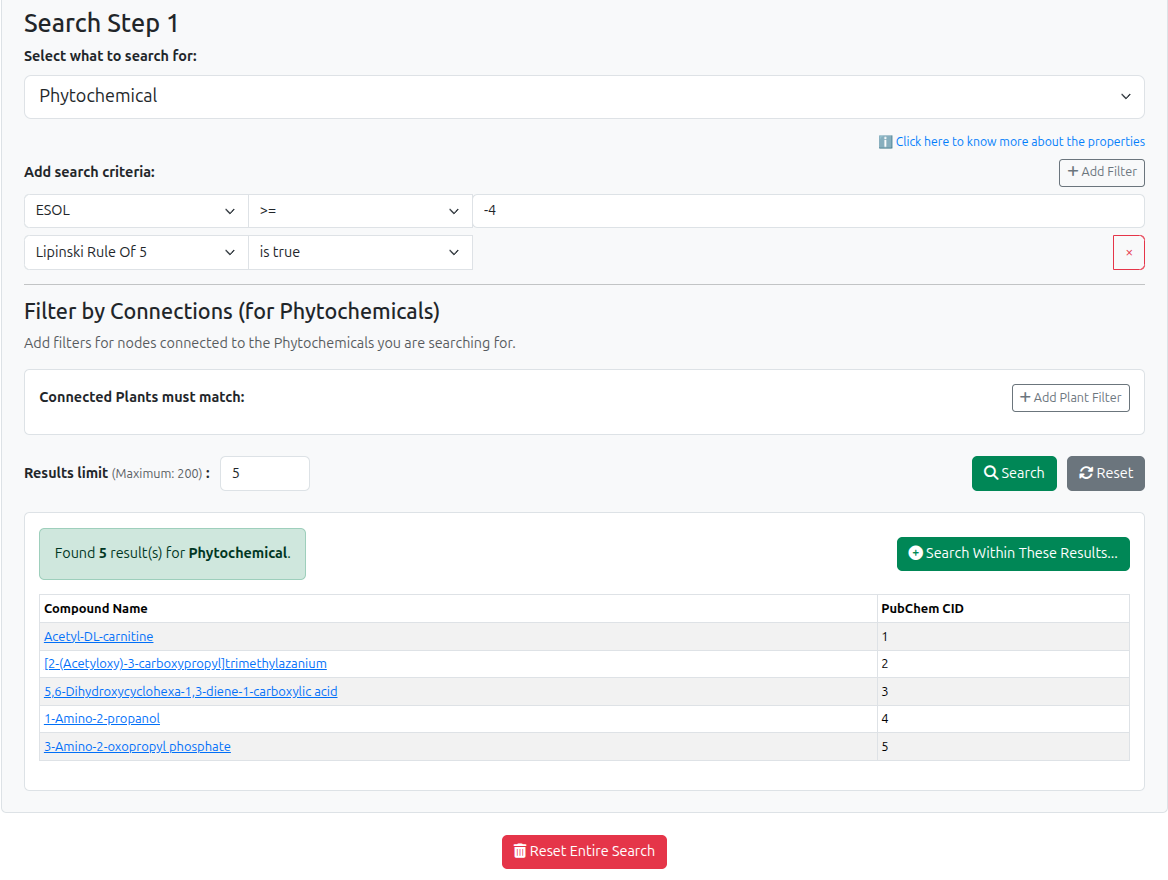
In this example, we have set a limit of 5 results to display. This limit can be adjusted in the 'Results limit' field before running the search. Clicking on any entry in the results table will take you to the detailed page for that specific entity.
How to Perform a Multi-Step Search (Search Within Results)
You can also search within your results to perform a multi-step, exploratory search. Clicking on the "Search within these results" button at the top of the results table will start a new search step.
For example, starting from the phytochemicals found in the previous step, we can now find all the Plants associated with them. We can also add additional filters to narrow down this second-level search.
Ticking the box for 'find ALL connected items' will ignore any search criteria and return all connected items in the selected category.
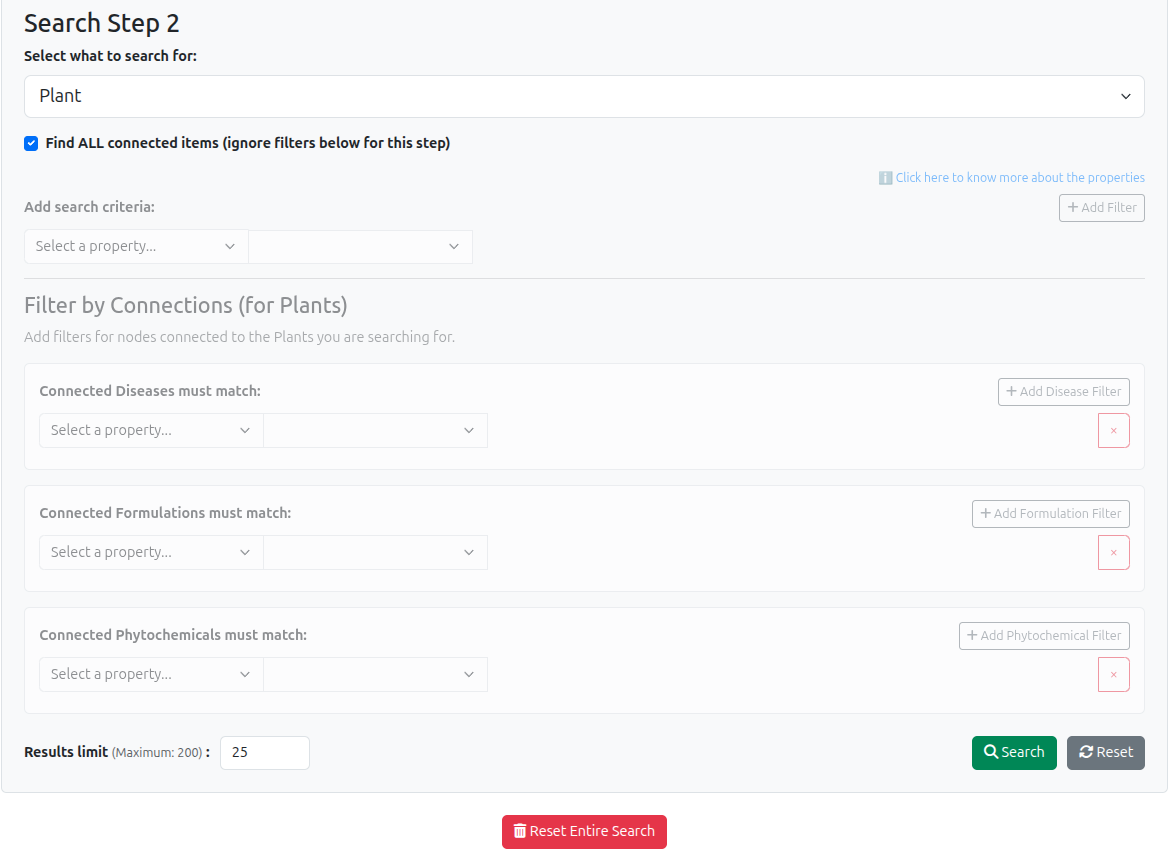
The results of this new search step will be displayed in a new table below the original results.

This process can be continued further by clicking on the 'Search within these results' button again, allowing you to explore the data connections in depth.
A list of Ayurvedic terms and their descriptions adapted from Ayurvedic Standard Treatment Guidelines and Ayurvedic Pharmacopeia as used in the GRAYU database.
Loading glossary...