Pfam Domains mapped on to the structure: 3F3S
No.
Chain ID
Pfam ID
Pfam Description
Linkout - Pfam
Linkout - CDD
1
A
PF02737
3-hydroxyacyl-CoA dehydrogenase, NAD binding domain
PF02737
PF02737
2
A
PF00725
3-hydroxyacyl-CoA dehydrogenase, C-terminal domain
PF00725
PF00725
Gene Ontology Annotations: 3F3S
Conserved Domain Database Superfamily Annotations: 3F3S
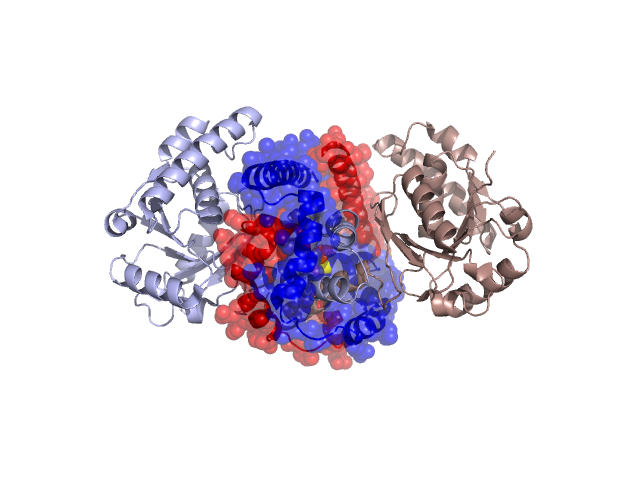
Structural Details of PDB entry 3F3S
Structural Details of PDB entry 3F3S
PDBid Chains Hinge Swapped Domain
3F3S
A,B
A:232-237,B:232-237
A:238-316,B:238-316
Swapped-domain interface residues and interactions:
Chains Residues
A
191 , 192 , 197 , 200 , 221 , 230 , 238 , 239 , 240 , 241 , 242 , 243 , 244 , 245 , 246 , 247 , 248 , 249 , 251 , 252 , 253 , 254 , 255 , 256 , 258 , 259 , 260 , 261 , 262 , 263 , 264 , 265 , 266 , 269 , 271 , 272 , 274 , 277 , 278 , 280 , 281 , 284 , 288 , 290 , 292 , 295 , 298 , 299 , 301 , 302 , 305 , 306 , 308 , 309 , 310 , 312 , 313 , 315 , 316 ,
B
191 , 197 , 200 , 203 , 221 , 230 , 231 , 238 , 239 , 240 , 241 , 242 , 243 , 244 , 246 , 247 , 248 , 249 , 251 , 252 , 253 , 255 , 256 , 258 , 259 , 260 , 261 , 262 , 263 , 264 , 265 , 266 , 269 , 271 , 272 , 274 , 277 , 278 , 280 , 281 , 284 , 288 , 290 , 295 , 298 , 299 , 301 , 302 , 305 , 306 , 308 , 309 , 310 , 312 , 313 ,
Non-swapped-domain interface residues and interactions:
Chains Residues
A
147 , 148 , 153 , 154 , 155 , 182 , 184 , 185 , 186 , 187 , 188 , 190 , 194 , 195 , 198 , 199 , 201 , 202 , 203 , 204 , 205 , 206 , 207 , 209 , 212 , 213 , 214 , 215 , 219 , 220 , 222 , 223 , 224 , 225 , 226 , 227 , 228 , 229 , 231 , 232 , 233 , 234 , 235 , 236 , 237 ,
B
97 , 124 , 125 , 130 , 147 , 148 , 153 , 154 , 155 , 182 , 184 , 186 , 187 , 188 , 190 , 194 , 195 , 198 , 199 , 201 , 202 , 204 , 205 , 206 , 207 , 209 , 212 , 213 , 214 , 215 , 216 , 219 , 220 , 222 , 223 , 224 , 225 , 226 , 227 , 228 , 229 , 232 , 233 , 234 , 235 , 236 , 237 ,
Mutations in critical regions:
Chains
Hinge
Domain swapped interface Non-swapped interface Swapped Domain
A No mutation No mutation No mutation No mutation B No mutation No mutation No mutation No mutation
HIDE output:
JMOL Visualization:
2D-plot:
JOY Structural annotation for hinge hinge and swapped domain:
JOY output: