Home BrowseSearch Help Group

Pfam Domains mapped on to the structure: 2QYP

No. Chain ID Pfam ID Pfam Description Linkout - Pfam Linkout - CDD
1 A PF05184 Saposin-like type B, region 1 PF05184 PF05184
2 A PF03489 Saposin-like type B, region 2 PF03489 PF03489

Gene Ontology Annotations: 2QYP

No. GO ID GO Description Linkout - AmiGO
1 GO:0006629 lipid metabolic process GO:0006629

Conserved Domain Database Superfamily Annotations: 2QYP

No. PDB ID PSSM ID CDD Accession Superfamily Short Name Linkout - CDD
1 2QYP 191220 cl04972 SapB_1 superfamily - -
2 2QYP 191220 cl04972 SapB_1 superfamily - -
Structural Details of PDB entry 2QYP

Structural Details of PDB entry 2QYP

PDBid Chains Hinge Swapped Domain
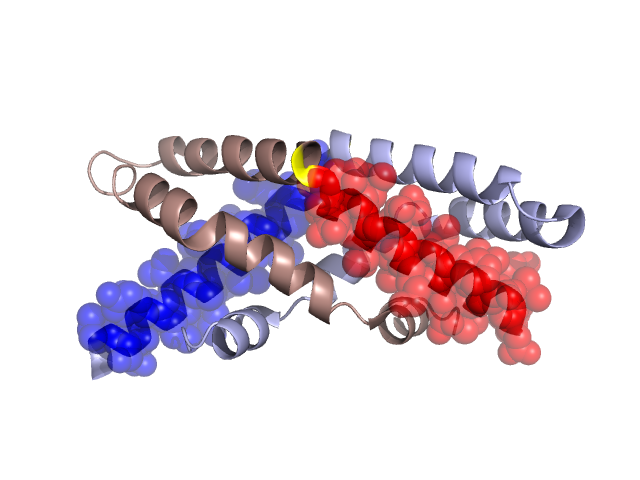
2QYP A,B A:22-22,B:22-22 A:1-21,B:0-21

Swapped-domain interface residues and interactions:

Chains Residues
A 3, 4, 6, 7, 10, 11, 12, 14, 15, 18, 19, 28, 58,
B 4, 7, 8, 11, 12, 14, 15, 18, 19, 28, 32, 47, 50, 58,

Non-swapped-domain interface residues and interactions:

Chains Residues
A 23, 24, 27, 31, 32, 35, 50, 51, 54, 55, 57, 59, 61, 62, 65, 66, 70, 71, 74, 75, 77, 78,
B 23, 24, 27, 31, 35, 39, 43, 46, 49, 51, 54, 57, 59, 61, 62, 65, 66, 70, 71, 74, 75, 77,

Swapped domains are represented using trasperent spheres.
Non-swapped part is represented using light color and cartoon representation.
Hinge region is shown in yellow color.

Mutations in critical regions:

Chains Hinge Domain swapped interface Non-swapped interface Swapped Domain
ANo mutationNo mutationNo mutationNo mutation
BNo mutationNo mutationNo mutationNo mutation

HIDE output:

Homologues found through HIDE algorithm

JMOL Visualization:

Jmol_logo            Jmol_logo            Jmol_logo

2D-plot:

A:2QYP B:2QYP

JOY Structural annotation for hinge hinge and swapped domain:

Hinge Swapped domain

JOY output:

ali file:2QYP.ali
atm file:2QYP.atm
cof file:2QYP.cof
hbd file:2QYP.hbd
html file:2QYP.html
pdb file:2QYP.pdb
ps file:2QYP.ps
psa file:2QYP.psa
rtf file:2QYP.rtf
sst file:2QYP.sst
tem file:2QYP.tem