Pfam Domains mapped on to the structure: 2QCK
No.
Chain ID
Pfam ID
Pfam Description
Linkout - Pfam
Linkout - CDD
1
A
PF01613
Flavin reductase like domain
PF01613
PF01613
Conserved Domain Database Superfamily Annotations: 2QCK
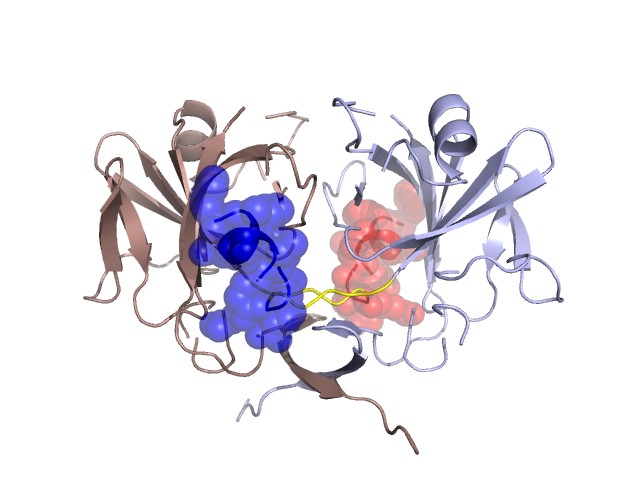
Structural Details of PDB entry 2QCK
Structural Details of PDB entry 2QCK
PDBid Chains Hinge Swapped Domain
2QCK
A,B
A:19-23,B:19-23
A:8-18,B:8-18
Swapped-domain interface residues and interactions:
Chains Residues
A
8 , 9 , 11 , 12 , 13 , 14 , 16 , 17 , 18 , 44 , 50 , 140 , 142 , 148 ,
B
8 , 9 , 11 , 12 , 13 , 14 , 16 , 17 , 18 , 44 , 50 , 140 , 142 , 148 ,
Non-swapped-domain interface residues and interactions:
Chains Residues
A
19 , 20 , 21 , 22 , 24 , 41 , 42 , 43 , 45 , 46 , 47 , 48 , 49 , 51 , 53 , 55 , 79 , 114 , 117 , 125 , 127 , 128 , 129 , 130 , 132 , 134 , 137 , 138 , 139 , 145 , 150 , 152 , 155 , 156 , 157 , 158 , 159 , 160 , 161 , 162 , 166 ,
B
19 , 20 , 21 , 22 , 24 , 41 , 42 , 43 , 45 , 46 , 47 , 48 , 49 , 51 , 53 , 55 , 79 , 114 , 117 , 125 , 127 , 128 , 129 , 130 , 132 , 134 , 137 , 138 , 139 , 145 , 150 , 152 , 155 , 156 , 157 , 158 , 159 , 160 , 161 , 162 ,
Mutations in critical regions:
Chains
Hinge
Domain swapped interface Non-swapped interface Swapped Domain
A No mutation No mutation No mutation No mutation B No mutation No mutation No mutation No mutation
HIDE output:
JMOL Visualization:
2D-plot:
JOY Structural annotation for hinge hinge and swapped domain:
JOY output: