Pfam Domains mapped on to the structure: 2PV3
Gene Ontology Annotations: 2PV3
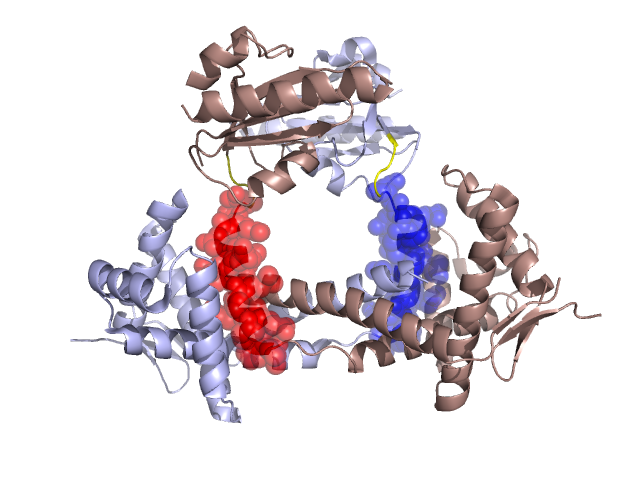
Structural Details of PDB entry 2PV3
Structural Details of PDB entry 2PV3
PDBid Chains Hinge Swapped Domain
2PV3
A,B
A:149-152,B:149-152;A:170-173,B:170-173
A:153-169,B:153-169
Swapped-domain interface residues and interactions:
Chains Residues
A
95 , 98 , 99 , 102 , 103 , 136 , 153 , 154 , 155 , 157 , 158 , 159 , 162 , 163 , 166 ,
B
95 , 98 , 99 , 102 , 103 , 136 , 140 , 153 , 154 , 155 , 157 , 158 , 159 , 162 , 163 , 166 ,
Non-swapped-domain interface residues and interactions:
Chains Residues
A
52 , 55 , 56 , 57 , 58 , 73 , 106 , 107 , 132 , 135 , 138 , 139 , 140 , 142 , 143 , 147 , 152 , 172 , 235 , 237 , 238 , 240 , 241 , 242 , 251 , 252 , 261 , 262 , 272 , 273 , 391 , 394 , 395 , 398 , 399 , 402 , 403 , 406 , 407 , 427 ,
B
55 , 56 , 57 , 58 , 73 , 91 , 106 , 107 , 135 , 139 , 142 , 143 , 147 , 235 , 237 , 238 , 240 , 241 , 242 , 251 , 252 , 261 , 262 , 272 , 273 , 391 , 394 , 395 , 398 , 399 , 402 , 403 , 406 , 407 , 410 , 414 ,
Mutations in critical regions:
Chains
Hinge
Domain swapped interface Non-swapped interface Swapped Domain
A No mutation No mutation No mutation No mutation B No mutation No mutation No mutation No mutation B No mutation No mutation No mutation No mutation
HIDE output:
JMOL Visualization:
2D-plot:
JOY Structural annotation for hinge hinge and swapped domain:
JOY output: