Pfam Domains mapped on to the structure: 1QPS
No.
Chain ID
Pfam ID
Pfam Description
Linkout - Pfam
Linkout - CDD
1
A
PF02963
Restriction endonuclease EcoRI
PF02963
PF02963
Gene Ontology Annotations: 1QPS
No.
GO ID
GO Description
Linkout - AmiGO
1
GO:0009307
DNA restriction-modification system
GO:0009307
Conserved Domain Database Superfamily Annotations: 1QPS
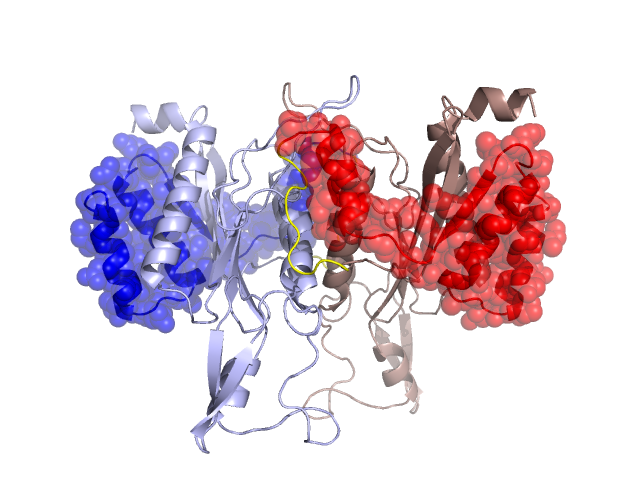
Structural Details of PDB entry 1QPS
Structural Details of PDB entry 1QPS
PDBid Chains Hinge Swapped Domain
1QPS
A,B
A:76-85,B:76-85
A:17-75,B:17-75
Swapped-domain interface residues and interactions:
Chains Residues
A
63 , 70 , 73 , 74 , 223 , 225 ,
B
63 , 70 , 73 , 74 , 223 , 225 ,
Non-swapped-domain interface residues and interactions:
Chains Residues
A
76 , 77 , 78 , 79 , 80 , 82 , 83 , 86 , 141 , 142 , 144 , 145 , 147 , 148 , 151 , 152 , 155 , 158 , 159 , 161 , 176 , 193 , 194 , 196 , 199 , 201 , 202 , 203 , 205 , 206 , 209 , 210 , 211 , 213 , 221 , 222 , 224 , 228 , 229 , 230 , 231 , 232 , 277 ,
B
76 , 77 , 78 , 79 , 80 , 82 , 83 , 86 , 141 , 142 , 144 , 145 , 147 , 148 , 151 , 152 , 155 , 158 , 159 , 161 , 176 , 193 , 194 , 196 , 199 , 201 , 202 , 203 , 205 , 206 , 209 , 210 , 211 , 213 , 221 , 222 , 224 , 228 , 229 , 230 , 231 , 232 ,
Mutations in critical regions:
Chains
Hinge
Domain swapped interface Non-swapped interface Swapped Domain
A No mutation No mutation No mutation No mutation B No mutation No mutation No mutation No mutation
HIDE output:
JMOL Visualization:
2D-plot:
JOY Structural annotation for hinge hinge and swapped domain:
JOY output: