Pfam Domains mapped on to the structure: 1FG9
Gene Ontology Annotations: 1FG9
Conserved Domain Database Superfamily Annotations: 1FG9
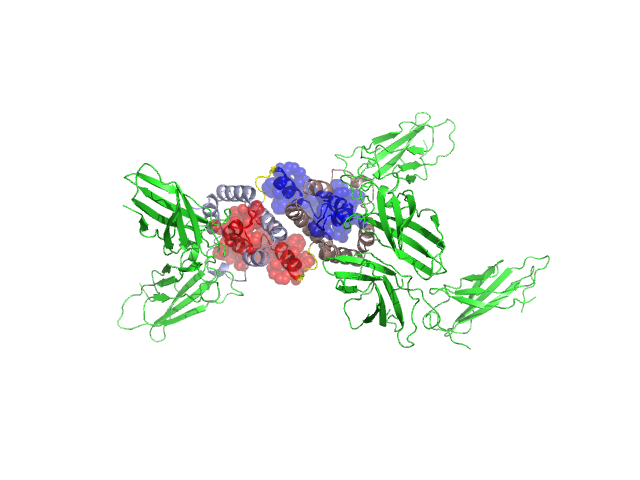
Structural Details of PDB entry 1FG9
Structural Details of PDB entry 1FG9
PDBid Chains Hinge Swapped Domain
1FG9
A,B
A:82-86,B:82-86
A:87-126,B:87-126
Swapped-domain interface residues and interactions:
Chains Residues
A
5 , 8 , 12 , 15 , 17 , 22 , 28 , 30 , 32 , 37 , 39 , 45 , 48 , 56 , 80 , 81 , 87 , 88 , 91 , 92 , 94 , 95 , 96 , 98 , 100 , 101 , 105 , 106 , 107 , 108 , 109 , 110 , 111 , 112 , 113 , 114 , 115 , 116 , 117 , 118 , 119 , 120 , 121 , 122 , 123 , 125 , 126 ,
B
5 , 8 , 12 , 15 , 17 , 18 , 22 , 28 , 30 , 32 , 45 , 46 , 48 , 52 , 56 , 80 , 81 , 87 , 88 , 91 , 92 , 94 , 95 , 96 , 98 , 100 , 101 , 105 , 106 , 107 , 108 , 109 , 110 , 111 , 112 , 113 , 114 , 115 , 116 , 117 , 118 , 119 , 120 , 121 , 122 , 124 , 125 , 126 ,
C
206 ,
D
173 , 206 ,
Non-swapped-domain interface residues and interactions:
Chains Residues
A
0 , 1 , 3 , 4 , 9 , 11 , 16 , 18 , 19 , 20 , 21 , 23 , 24 , 25 , 26 , 27 , 29 , 33 , 34 , 35 , 36 , 40 , 41 , 42 , 43 , 44 , 46 , 47 , 49 , 51 , 52 , 53 , 55 , 59 , 60 , 73 , 77 , 85 ,
B
0 , 1 , 4 , 9 , 11 , 16 , 19 , 20 , 21 , 23 , 24 , 25 , 26 , 27 , 29 , 33 , 34 , 35 , 36 , 39 , 40 , 41 , 42 , 43 , 44 , 47 , 49 , 51 , 53 , 55 , 59 , 60 , 73 , 77 , 83 , 85 ,
C
47 , 49 , 50 , 51 , 52 , 53 , 54 , 78 , 79 , 80 , 82 , 98 , 101 , 106 , 147 , 149 , 153 , 164 , 165 , 166 , 167 , 168 , 169 , 171 , 173 , 174 , 175 , 177 , 180 , 186 , 188 , 203 , 205 , 207 , 208 , 224 ,
D
47 , 49 , 50 , 51 , 52 , 53 , 54 , 76 , 78 , 79 , 80 , 82 , 98 , 101 , 106 , 148 , 149 , 175 , 176 , 205 , 207 , 208 , 221 ,
E
114 , 115 , 116 , 117 , 118 , 119 , 129 , 195 , 215 , 216 , 217 , 218 , 219 , 220 ,
Mutations in critical regions:
Chains
Hinge
Domain swapped interface Non-swapped interface Swapped Domain
A No mutation No mutation No mutation No mutation B No mutation No mutation No mutation No mutation
HIDE output:
JMOL Visualization:
2D-plot:
JOY Structural annotation for hinge hinge and swapped domain:
JOY output: